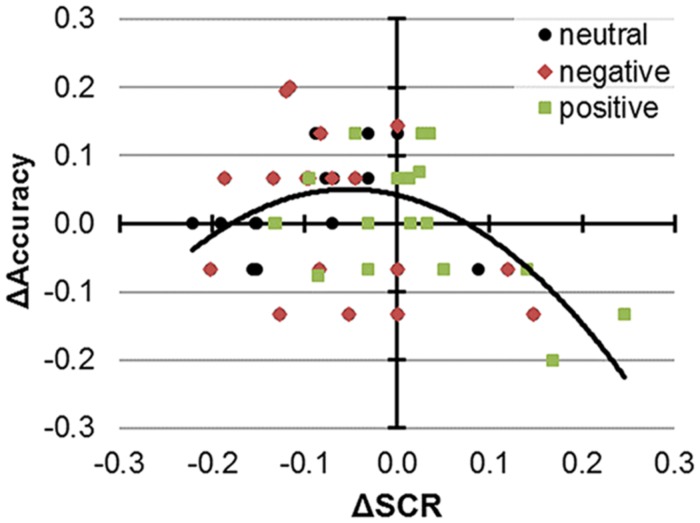
FIGURE 2.
Performance and SCR modulations by 1 mA anodal tDCS. Color and shape indicate responses to neutral, negative, and positive stimuli. In the corresponding regression model, the depicted quadratic term and the intercept were significant predictors of performance changes and there was no additional variance explained by valence.

