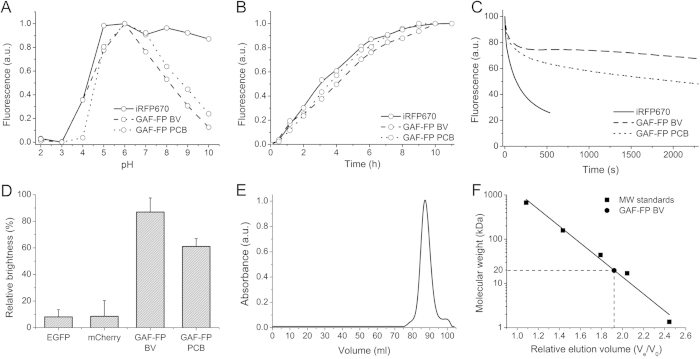
Figure 3. Biochemical and photochemical properties of GAF-FP.
(A) The pH dependence of fluorescence in comparison with iRFP670 control. (B) Fluorescence acquisition kinetics of GAF-FP bound with either BV or PCB chromophores and of iRFP670 control at 37 °C. Time “0” corresponds to the beginning of the 1 h long pulse-chase induction of the protein expression. (C) Photobleaching kinetics for GAF-FP with either BV or PCB, and for iRFP670 control. The curves were normalized to absorbance spectra and extinction coefficients of FPs, spectrum of the lamp, and transmission of an excitation filter. (D) Efficiency of fluorescence acquisition by GAF-FP in anaerobic conditions. The ratio of a fluorescence signal of bacterial cells, expressing either GFP-like proteins (EGFP or mCherry) or GAF-FP with either BV or PCB, after 24 h in anaerobic condition to a fluorescence signal developed after subsequent 24 h maturation of these FPs in presence of oxygen. Error bars, s.d. (n = 3). (E) Size-exclusion chromatography of GAF-FP bound with BV. (F) Size exclusion chromatography calibration plot. GAF-FP peak corresponds to Ve/Vo value of 1.9. Ve, elution volume; V0, void volume of the column.

