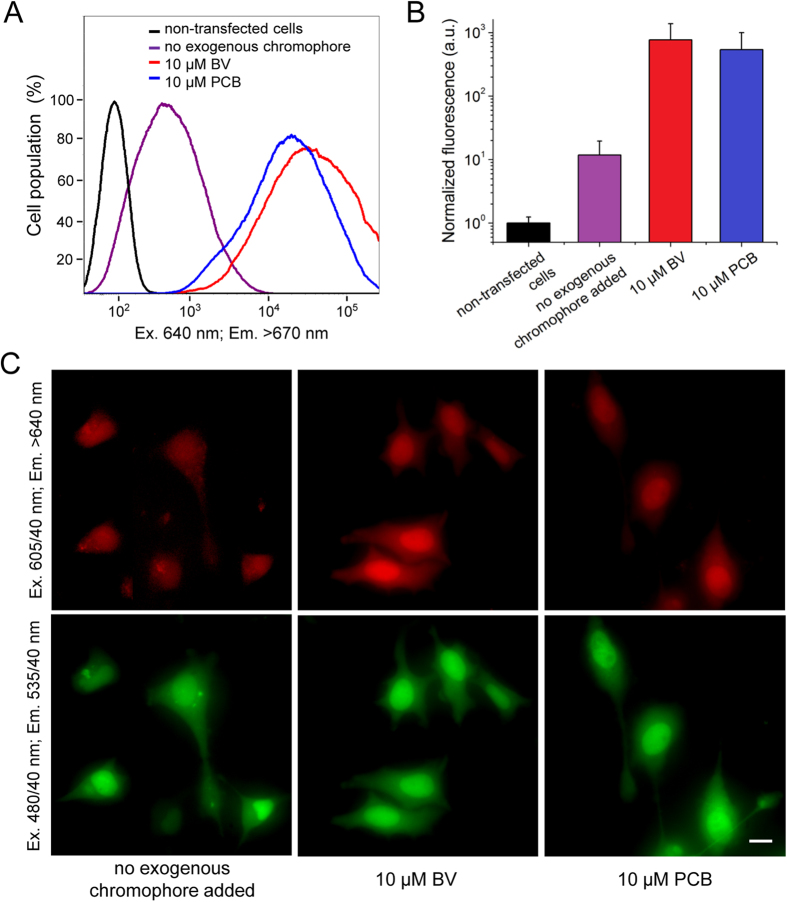
Figure 5. Expression of GAF-FP in mammalian cells.
(A) Flow cytometry histograms of live HeLa cells transiently transfected with the GAF-FP—sfGFP construct with and without addition of 10 μM BV or PCB. Only sfGFP positive cells were analyzed. The NIR fluorescence was excited by the 640 nm laser and detected using the 670 nm LP emission filter. (B) NIR fluorescence signal of live HeLa cells detected by flow cytometry and normalized to absorbance of the respective protein at the excitation wavelength and to overlap of the fluorescence spectrum of the protein with the transmission of the emission filter. Error bars, s.d. (n = 3). (C) NIR and green fluorescence images of live HeLa cells transiently transfected with the GAF-FP—sfGFP construct with and without addition of 10 μM BV or PCB. Acquisition time in the NIR channel for the left image was 6.5-fold larger than for the middle and left images. Scale bar, 20 μm.

