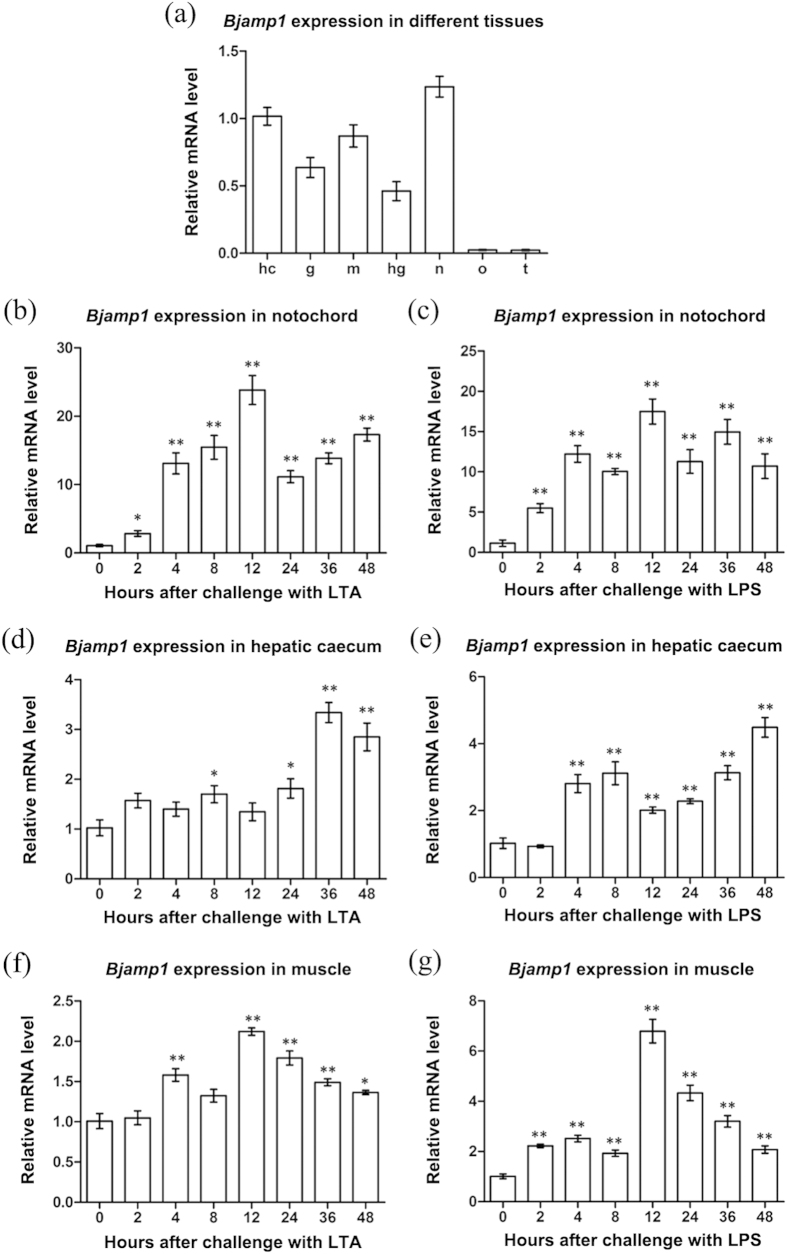
Figure 2. Tissue-specific as well as LPS- and LTA-induced expression of Bjamp1.
(a) Total RNA was extracted from various tissues of B. japonicum, and the expression profiles of Bjamp1 were determined in the different tissues by qRT-PCR. The expression level in the hepatic caecum was set as 1. Data were shown as mean ± SEM. hc, hepatic caecum; g, gill; m, muscle; hg, hind-gut; n, notochord; o, ovary; t, testis. (b–g) B. japonicum were sampled at 0, 2, 4, 8, 12, 24, 36 and 48 h after challenge with LPS or LTA, and total RNAs were extracted from notochord, hepatic caecum and muscle. The expression profiles of Bjamp1 was determined by qRT-PCR. In each case, the expression level of 0 hour was set as 1. Values were shown as mean ± SEM (n = 3). The symbol * indicates a significant difference (p < 0.05), and the symbol ** a extremely significant difference (p < 0.01).

