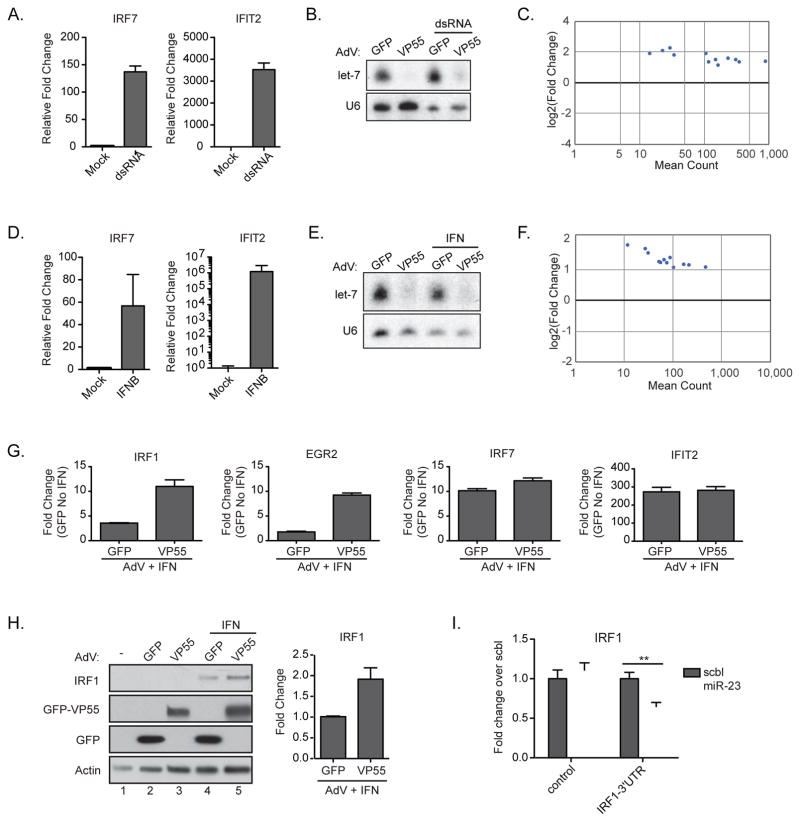
Figure 2. Depletion of miRNAs does not modulate the intrinsic response to virus.
(A) qPCR of RNA from BJ cells treated with poly(I:C) for 6hrs. All samples were normalized to tubulin. (B) Small RNA northern blot of BJ cells treated with AdV-GFP or AdV-VP55 for 24 hrs prior to transfection with dsRNA. Total RNA collected 6hrs post-transfection. (C) Differentially expressed transcripts with a greater than 2-fold induction from mRNA-Seq of samples in (B). Statistical analysis was performed on 2 biological replicates per condition. (D) qPCR of RNA from BJ cells treated with IFNβ for 6 hrs. All samples were normalized to tubulin. (E) Small RNA northern blot of BJ cells treated with AdV-GFP or AdV-VP55 for 24hrs alone or prior treatment with IFNβ for 6hrs. (F) Differentially expressed transcripts with a greater than 2-fold induction from mRNA-Seq of samples in (E). Analysis was performed on two biological replicates per condition. (G) qPCR validation of selected genes from (F). All samples were normalized to tubulin. Fold change over samples treated with AdV-GFP alone. (H) Western blot (left) and quantification (right) of BJ cells treated with AdV-GFP or AdV-VP55 as described in (E). IRF1 levels were normalized to actin. Fold change over AdV-GFP+IFN. Average of two independent experiments. (I) Gaussia luciferase reporter assay containing either the 3′UTR of IRF1 or the 3′UTR with mutated putative miR-23 target site. NoDice cells were co-transfected with indicated reporter and either a miR-23 or scrambled miRNA mimetic. ** p < 0.005 from a one-tailed Student’s t test. Representative of 3 independent experiments. For all graphs, Error bars denote ± SD.

