
Fig. 5.
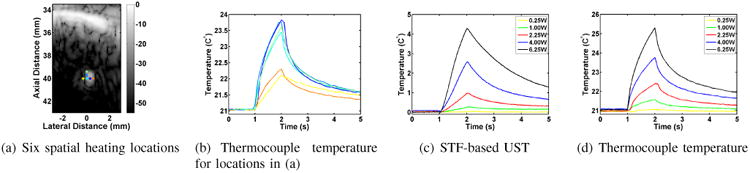
DMUA tFUS heating in the vicinity of a thermocouple: (a) SA image with six tFUS spots (0.3 mm spacing), (b) T/C measurements at dot corresponding to tFUS spot locations, (c)& (d) temperature profiles obtained using UST and T/C measurement (at blue dot).