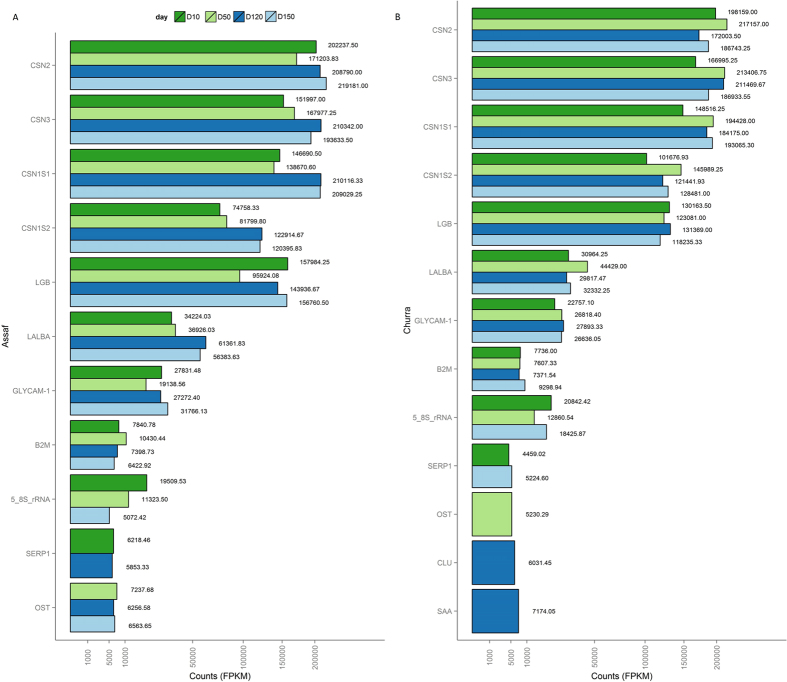
Figure 1. Bar graph with the highly expressed genes in milk somatic cells at 10, 50, 120 and 150 days of lactation.
FPKM values are represented in the X-axis, whereas the gene names are indicated in Y-axis. A color code is used to represent the four time points studied. (a) Top-10 highly expressed genes in Assaf. (b) Top-10 highly expressed genes in Churra.

