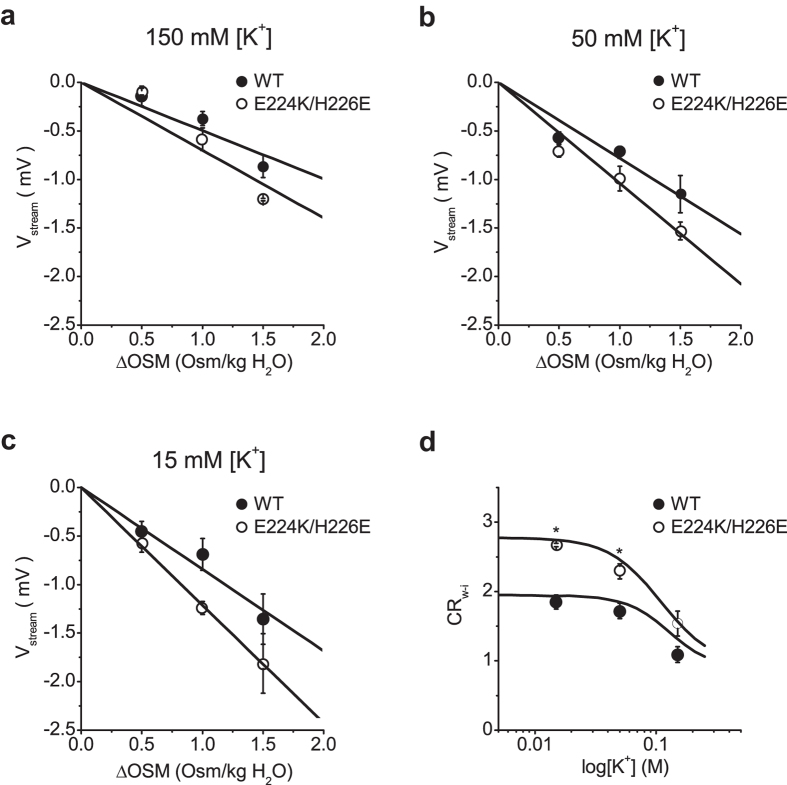
Figure 5. Dependence of Vstream on ΔOsm and [K+].
(a) The two Vstream – ΔOsm relationships were linear, with slope values of −0.63 ± 0.02 (mean ± standard error) and −0.83 ± 0.07 mV/Osm/kg in the wild-type and the mutant, respectively, at 150 mM [K+]. The line appeared to be steeper in the mutant than in the wild type, although there was no significant difference between the two regression lines (p = 0.07). (b) At 50 mM [K+], the two slope values were significantly different, with −0.82 ± 0.01 in the wild-type and −1.08 ± 0.02 mV/Osm/kg in the mutant (p < 0.05). (c) At 15 mM [K+], the slope value further increased, to −0.98 ± 0.07 and −1.35 ± 0.03 mV/Osm/kg for the wild-type and the mutant, respectively. The two slopes were significantly different (p < 0.05). (d) The relationship between CRw-i and log[K+]. The CRw-i value decreased from 2.15 ± 0.15 at 15 mM [K+] to 1.39 ± 0.04 at 150 mM [K+] (1.80 ± 0.03 at 50 mM [K+]) for the wild-type channel. The CRw-i values for the E224K/H226E mutant changed from 2.98 ± 0.07 at 15 mM [K+] to 1.84 ± 0.15 at 150 mM [K+] (2.37 ± 0.04 at 50 mM [K+]). The black curves were calculated from the model using cycle flux algebra. n = 3 to 6 for wild type; 3 to 4 for E224K/H226E.

