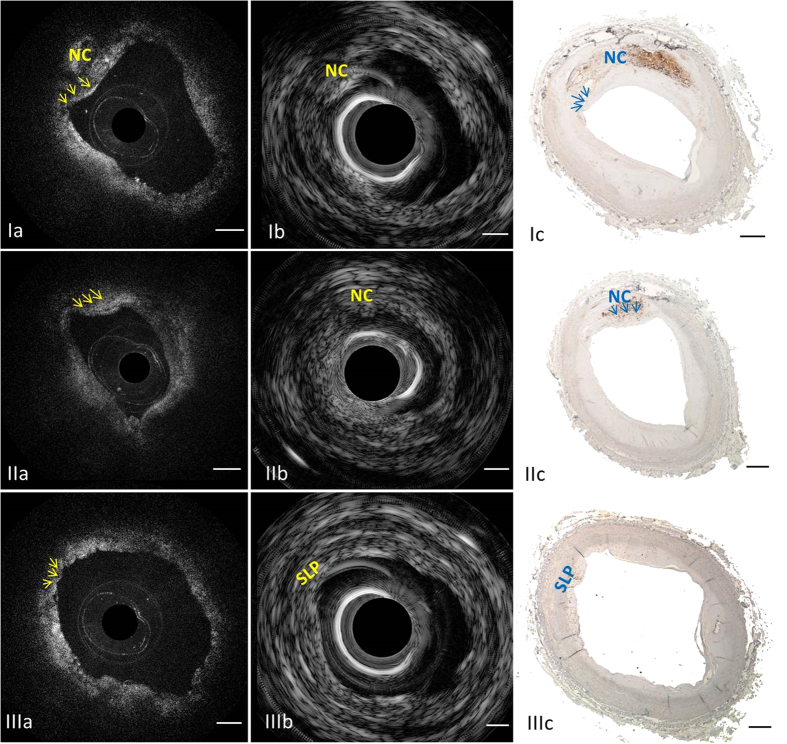
Figure 3. Characterizing human atherosclerotic plaques by the ultrafast IVUS-OCT system.
First row: Example of a TCFA. (Ia) OCT image in which arrows point at the fibrous cap; (Ib) corresponding IVUS image indicates the location of necrotic core; (Ic) photo of the corresponding histology slide with CD 68 stain, highlighting macrophages and necrotic core. Middle row: A false positive case of TCFA diagnosis based on IVUS-only (IIb) was produced due to the insufficient resolution and sensitivity. Size of the thick cap can be determined by the corresponding OCT (IIa) and CD 68 histology (IIc). Bottom row: A false positive case of TCFA diagnosis based on OCT-only (IIIa) was produced due to OCT’s limited penetration depth. A small lipid pool can be determined by IVUS (IIIb) and CD 68 histology (IIIc). Arrows denote the fibrous cap. NC: necrotic core; SLP: small lipid pool. Scale bar: 0.5 mm.

