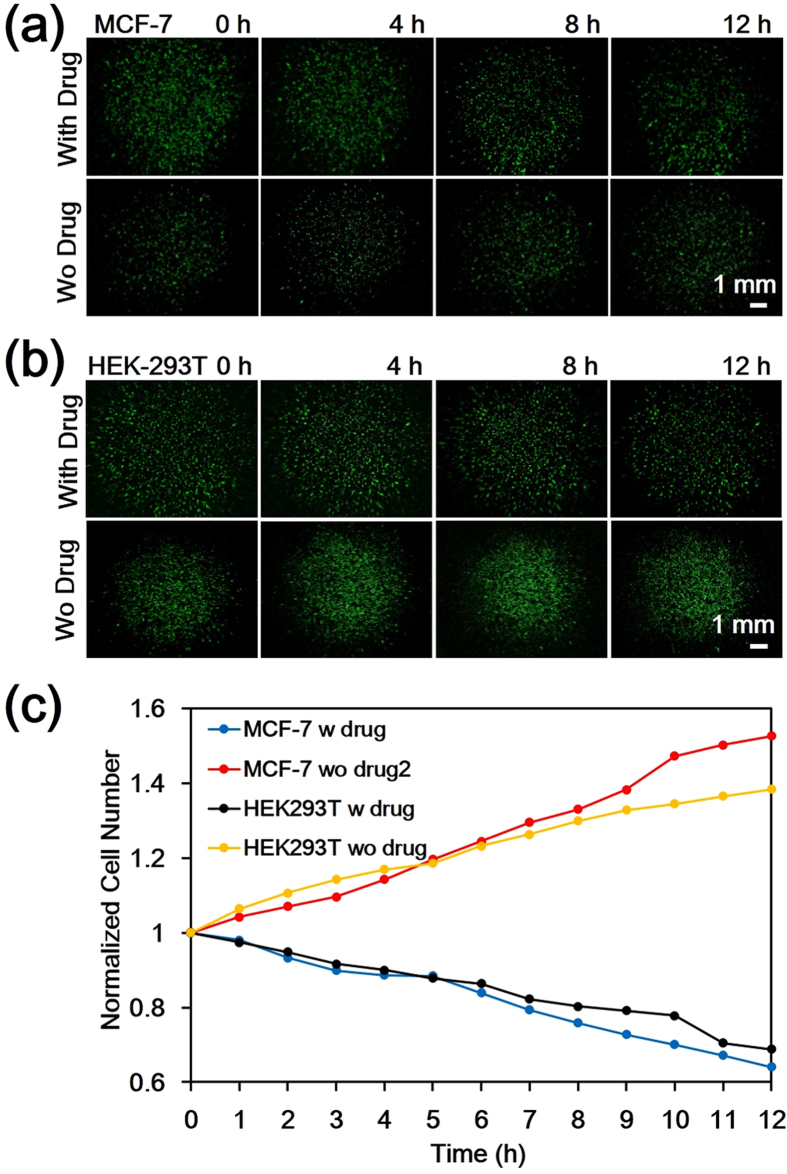
Figure 4. Time-course of cell response to paclitaxel anti-cancer drug treatment.
(a,b) Representative fluorescent images for GFP-labelled MCF-7 and HEK293T cell line, respectively, with paclitaxel treatment (upper row) and without (lower row) at 0, 4, 8 and 12 hours. All the images are taken by the w-SCOPE with magnification around 0.5X. (c) The plot of viable cell population counted over time from 0 to 12 h at 1 h intervals for both MCF-7 and HEK293T cell lines including the paclitaxel treatment group and control group.

