FIGURE 2.

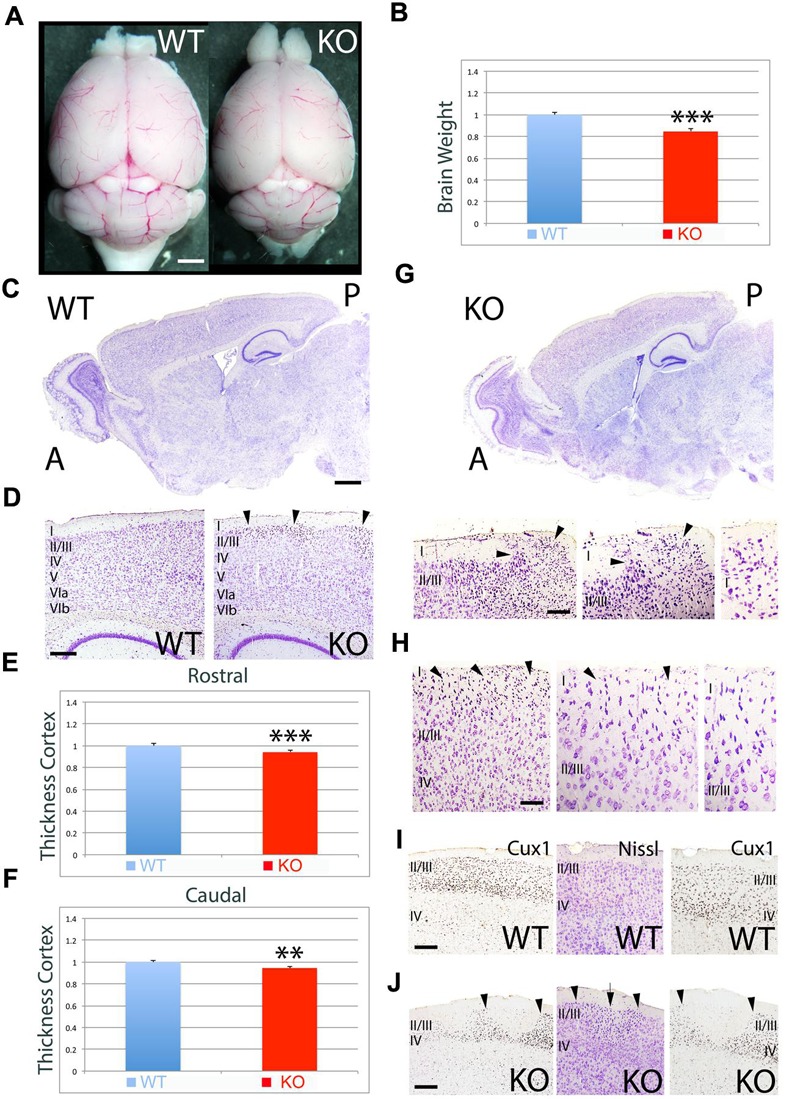
Neuroanatomical comparison between WT and KO in the adult. (A) Whole brain comparison between WT and KO. (B) Quantitation indicates a significant reduction in brain weight by 15% in the KO (0.85 ± 0.020, p = 0.0027∗∗∗, N = 4). (C) Sagittal sections stained with Nissl comparing WT and KO. (D) Nissl stained sections comparing the cortical thickness between WT and KO. (E,F) Quantitative analysis showing a significant reduction in cortical thickness by 6% at rostral (E, 0.94 ± 0.010, p = 0.0041∗∗∗, N = 4) and caudal (F, 0.94 ± 0.011, p = 0.0101∗∗, N = 4) levels in the KO compared to WT. (G,H) In the KO, cortical ectopias and heterotopias are observed in ULs including layer I. Arrowheads indicate the location of the ectopias in layer I at caudal (G) and rostral (H) levels. (I,J) Immunostaining for the UL marker Cux1 in WT (I) and KO (J). Cux1+ UL neurons present an abnormal distribution pattern in the KO (J), where patches of Cux1 negative neurons are observed. In (J), arrowheads mark the limits of the Cux1 negative territory in the ULs where heterotopias (arrow) negative for Cux1 are found. A, anterior; I-VIb, cortical layers 1 to 6b; P, posterior. Scale bars: (A) (0.5 mm), (C) (0.2 mm), (D) (125 μm), (G) (75 μm), (H) (50 μm), and (I,J) (100 μm).
