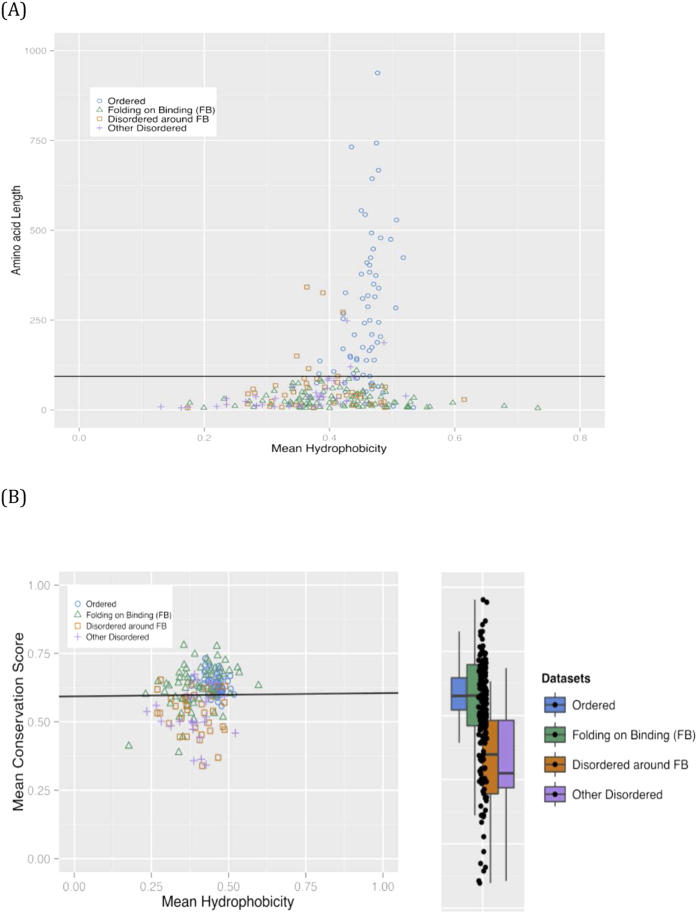
Figure 4. Analysis of the four region types as populations of sequences.
Only fragments ≥20 residues in length are used in the plots. The values of mean hydrophobicity and mean conservation score are normalized to the range [0,1]. (A) Mean Hydrophobicity versus length. The colour scheme is as for Fig. 3. A simple length threshold of region length = 93 was found to be the best boundary between Ordered and Other-Disordered regions; the same line was also optimal for discriminating between Ordered and either Disordered-around-FB or FB regions. (B) Mean conservation score versus mean hydrophobicity. The colour scheme is as for part (A). An almost horizontal line was found to be the best boundary between Ordered and Other-Disordered regions (equation S = 0.01 H + 0.59, where S is the mean conservation score and H is the mean hydrophobicity, in the fragments). Box plots are drawn using the same colour coding as the main scatter plot (see Fig. 3 legend for details).

