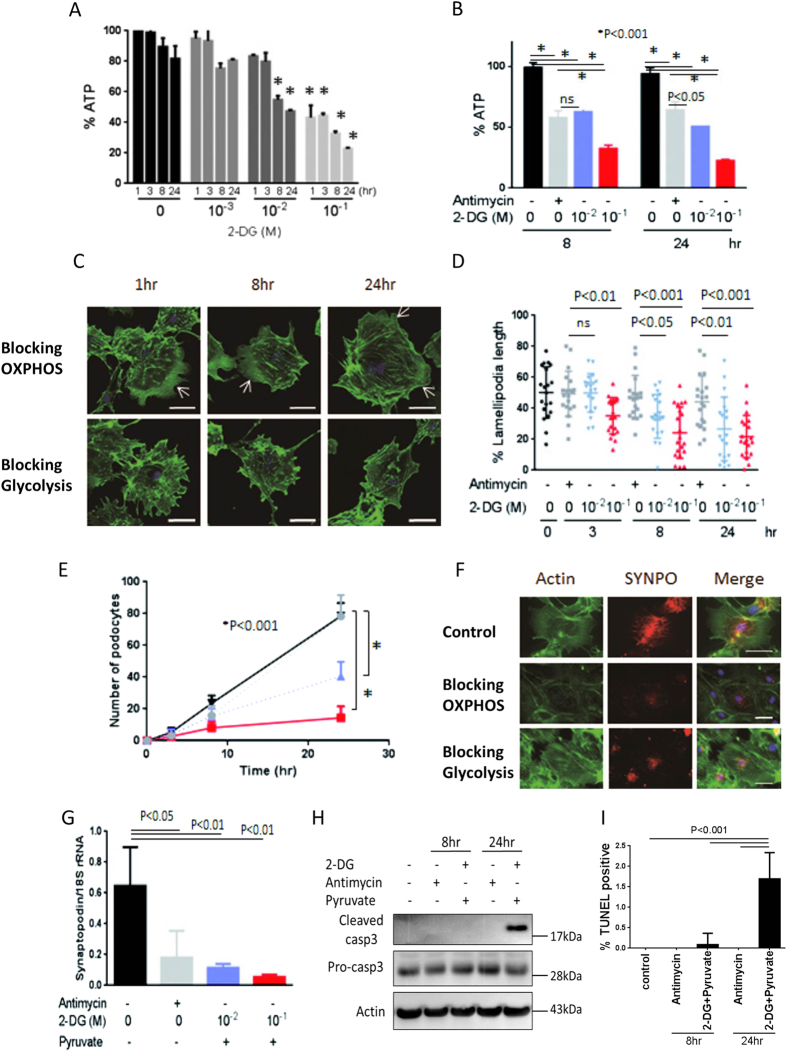
Figure 3. Effect of blocking OXPHOS or glycolysis on cell shape migration and apoptasis.
Dose- and time-dependent effects of 2-DG on ATP level. 10 mM 2-DG mildly and significantly reduced ATP level at 8 and 24 h (A). Intracellular ATP level following incubation with 10 mM 2-DG for 8 h was similar to that with 10 M antimycin (B). Assays using phalloidin-labeled actin filaments, showing that 10 mM 2-DG plus pyruvate prevented lamellipodia formation (arrow), whereas 10 μM antimycin had little effect on podocyte cell shape (C). Lamellipodia length was significantly reduced following incubation with 10 mM or 100 mM 2-DG plus 10 mM pyruvate after 8 and 24 h, but not with 10 μM antimycin (D). In contrast, 10 μM antimycin did not significantly alter lamellipodia formation (D). Both 10 mM (purple dotted line) and 100 mM (red dotted line) 2-DG significantly reduced podocyte migration at 24 h, whereas 10 μM antimycin (gray dotted line) had no effect (E). 2-DG plus pyruvate, as well as antimycin reduced synaptopodin (SYNPO) immunofluorescence (red); the green signal indicates actin (F). Synaptopodin mRNA expression measured by qPCR was significantly reduced by 2-DG plus pyruvate and by antimycin (G). 100 mM 2-DG induces cleaved caspase-3 (in the cropped blots) (H). and increases in the number of TNNEL-positive cells (I) in the cultured podocytes. However, antimycin did not show any response on these parameters (H,I). Bar, 50 μm. All blots in the each photo were run under the same experimental conditions. Size markers indicate the cropped level in each figure. Full length gels and blots for each figure are shown in Supplemental Figure 2.

