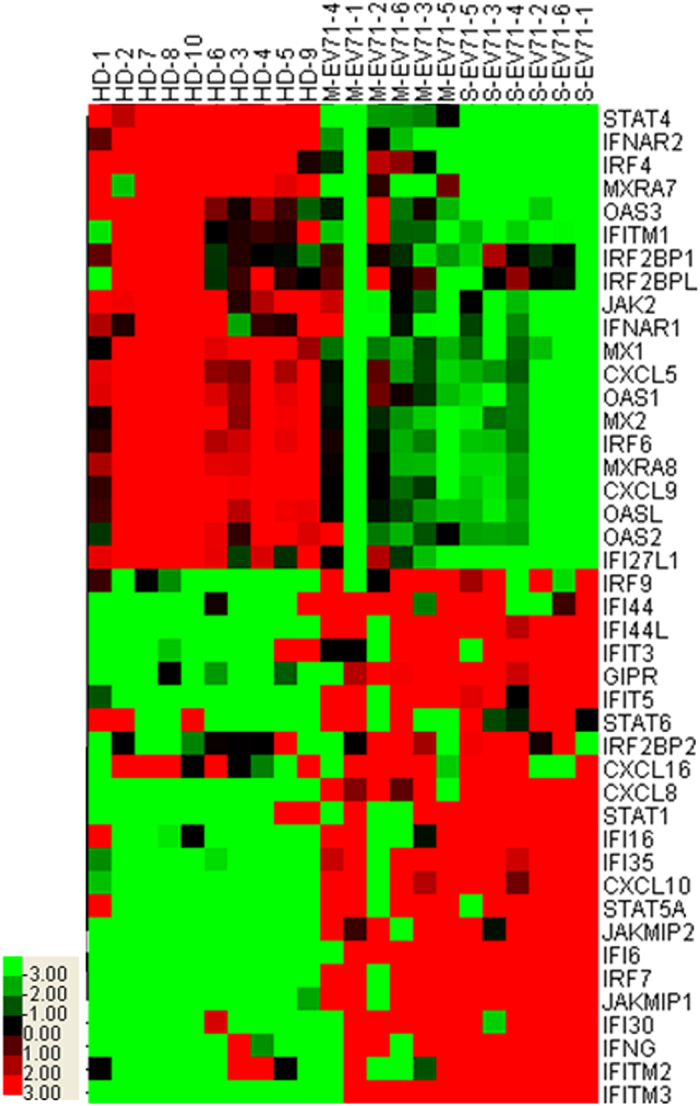
Figure 1. The mRNA expression profiles in PBMC from different populations.

Genome-wide transcriptional analysis was performed in PBMC isolated from different groups (HD, n = 10; M-EV71, n = 6; S-EV71, n = 6). Raw data was performed using Illumina software, then delineated the false discovery rate (FDR) and normalized. P < 0.05 was regarded as statistical significant.
