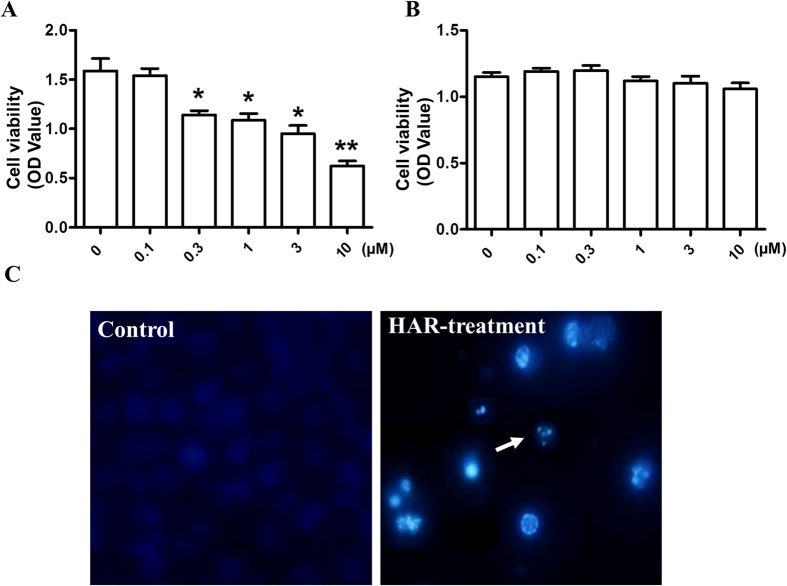
Figure 2. Antiproliferative activity of HAR.
(A) SGC-7901 cells were treated with different concentrations of HAR (0–10 μM) for 48 h. Cell viability was then measured using MTT method. (B) 3T3 cells were treated with different concentrations of HAR (0–10 μM) for 48 h. Cell viability was then measured using MTT method and the optical density (OD) value was determined at 570 nm. (C) The cells were treated without or with 5 μM HAR for 48 h, then the cells were stained by Hoechst 33258, the nuclear morphology of the cells was observed under a fluorescence microscope. Data are presented as means ± SD of three independent tests. *p < 0.05 versus control, **p < 0.01 versus control.

