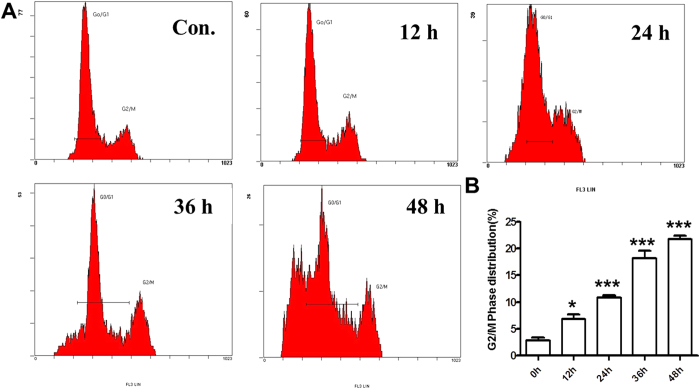
Figure 3. Effect of HAR on cell cycle distribution in SGC-7901 cells.
Cell cycle distribution was monitored by Flow cytometry. (A) PI staining assay was performed after 5 μM HAR-treatment for the indicated time periods. (B) Statistical analysis of G2/M phase distribution. Data are presented as means ± SD of three independent tests. *p < 0.05 versus control, ***p < 0.001 versus control.

