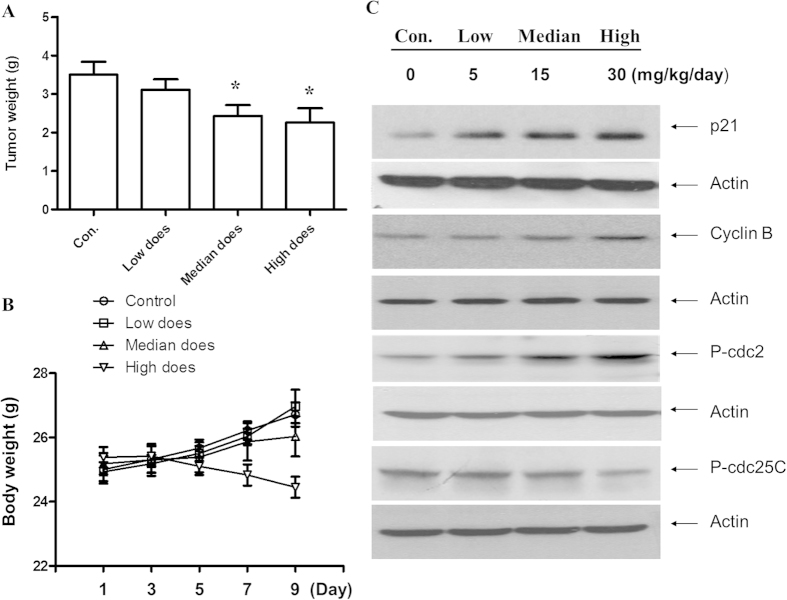
Figure 6. HAR prevented the subcutaneous xenograft tumor growth in vivo.
(A) The average tumor weights in HAR treatment group and control group were measured at the end of the experimental day (10 days treatment). *p < 0.05, n = 10. (B) The toxicity of HAR in SGC-7901 xenograft mouse model. Body weights of all of mice were assessed every other day after HAR treatment. (C) Expressions of cell cycle regulatory proteins on tumor tissue using Western Blot analysis. Fifteen micrograms of total protein from each sample were loading for each channel. Actin was used as an internal control from the same membrane. *p < 0.05 versus control.

