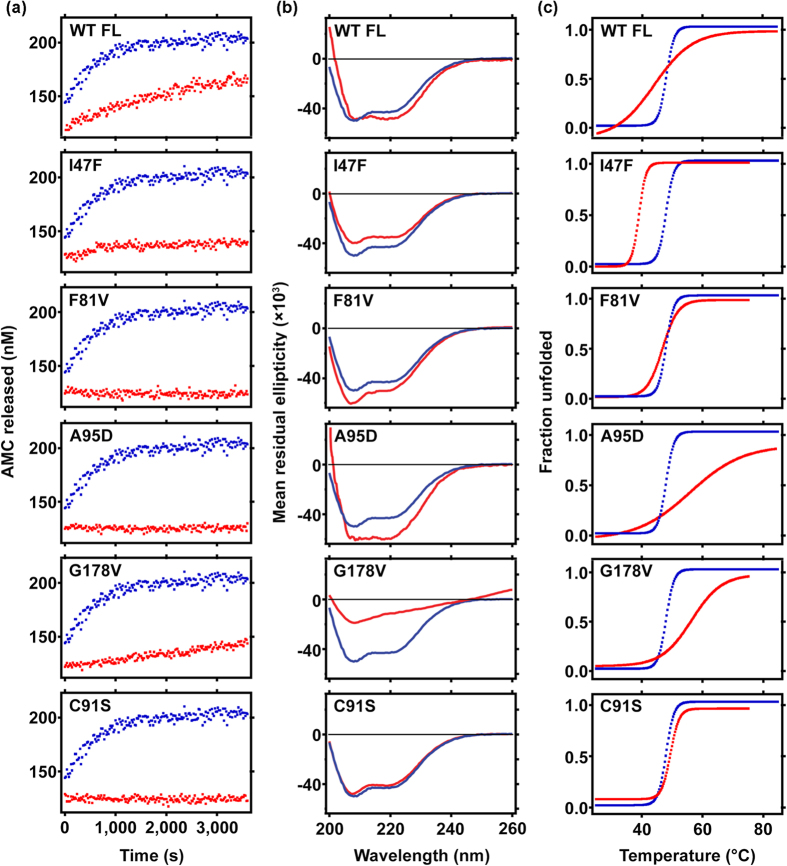
Figure 4. Comparative analysis of enzymatic activity, secondary structure and thermal stability of wild type BAP1 (1–240) with full length BAP1 and catalytic domain mutants.
(a) Progress curve shows Ub-AMC hydrolysis by BAP1 wild type (WT) and all catalytic domain mutants (I47F, F81V, A95D, G178V and C91S). Substrate and enzyme concentrations were 600 nM and 250 pM for all reactions respectively. The amount of AMC released from the substrate was estimated using concentration dependent plot of AMC. (b) Circular dichroism spectra at 25 °C of full length wild type BAP1 (WT FL), catalytic domain wild type BAP1 (WT 240) and catalytic domain mutants showed characteristic secondary structure between 200–260 nm. (c) Complete temperature unfolding profile at 222 nm demonstrated distinct unfolding nature of full length BAP1 (WT FL) and mutants in comparison with wild type catalytic domain BAP1 (WT 240). Melting temperatures were obtained from sigmoidal fits over the range 24 °C–84 °C. Catalytic domain BAP1 (WT 240) is denoted as blue curve. All mutants and full length BAP1 (WT FL) are represented as red curve.

