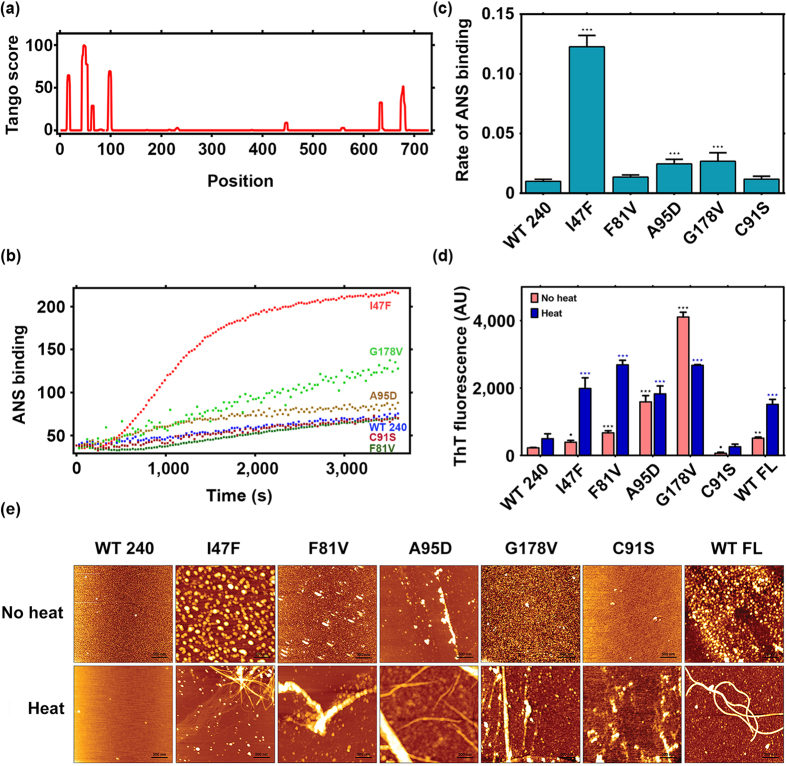
Figure 5. Characterization of fibrillar aggregates of BAP1.
(a) Tango prediction analysis displays aggregation prone sequences of BAP1 from 13–20, 43–52, 78–100 amino acid residues in the catalytic domain and 656–680 residues in the C terminal region. (b) ANS fluorescence experiments display extent of exposure of hydrophobic patches in wild type and mutant BAP1. (c) Bar diagram represents initial rate of aggregation kinetics of BAP1 as monitored by ANS fluorescence. (d) ThT fluorescence was used to detect aggregation propensity of BAP1. 20 μM of control (no heat) and heat induced BAP1 wild type (WT 240), full length BAP1 (WT FL) and mutants (I47F, F81V, A95D, G178V and C91S) were incubated with 20 μM ThT for 15 min. ThT fluorescence emission intensity shows binding of BAP1 aggregates. (e) AFM images of BAP1 (WT 240), I47F, F81V, A95D, G178V, C91S and full length BAP1 (WT FL) displayed amyloid fibril formation after heat induction. BAP1 (WT 240) and its inactive mutant C91S displayed spherical aggregates whereas I47F, A95D, G178V, and BAP1 (1–729) showed fibrillar aggregates of height ranging from 2–10 nm. Scan size of the AFM image was 3.0 μm x 3.0 μm. Representative results of three independent experiments. °p < 0.1, ***p < 0.001, **p < 0.01 and *p < 0.05.

