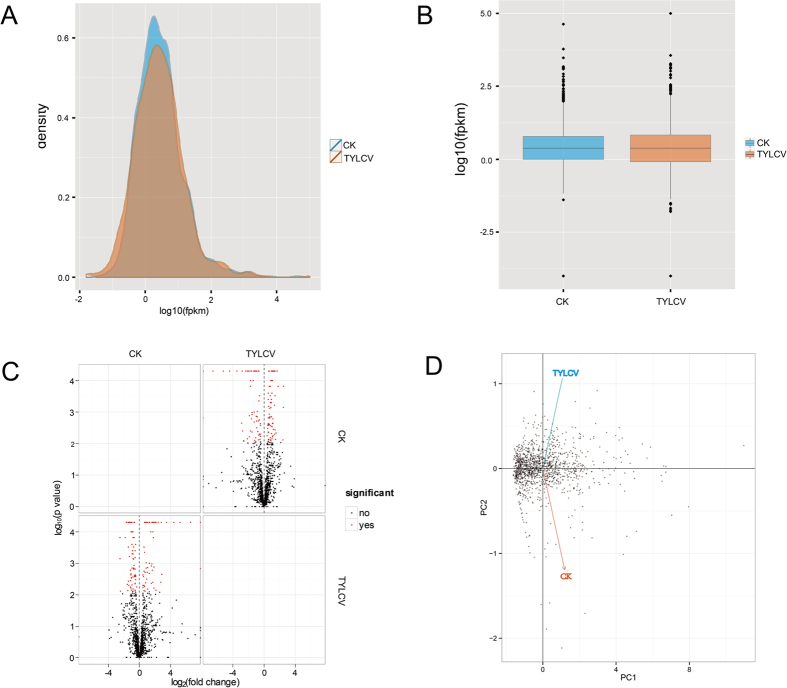
Figure 2. Global analysis of lncRNA expression in CK and TYLCV tomatoes.
(A) Expression density differences among the samples. (B) Expression scatter matrix. (C) Comparison of lncRNA expression between the CK and TYLCV samples. Red dots denote differentially expressed lncRNAs whereas black dots denote lncRNAs that were expressed comparably in the CK and TYLCV samples; (D) Principal component analysis of lncRNA expression between the CK and TYLCV samples.

