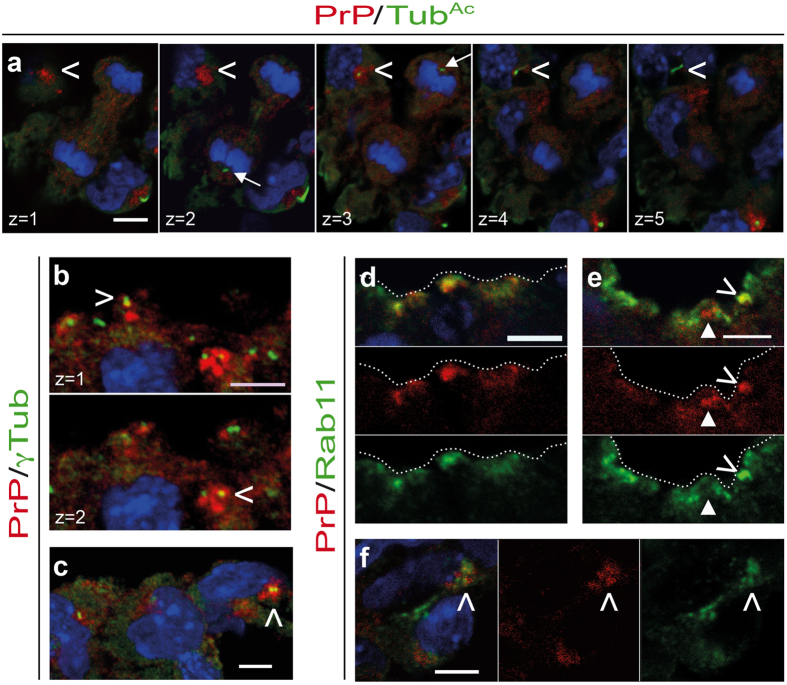
Figure 2. PrPC localization at the base of the primary cilium in progenitor cells of the developing nervous system and in the omphalomesenteric artery.
Confocal microscopy imaging of transverse sections of FVB/N mouse embryos at E9-9.5 co-stained for PrP (red) and (green) acetylated tubulin (TubAc) (a), γ-tubulin (γTub) (b,c) or Rab11 (d–f). Nuclei are stained with DAPI (blue). Merged confocal images or individual channels are shown. Z-series (a,b) or single optical sections (c–f) are presented. Co-localization of PrPC with TubAc at the level of the omphalomesenteric artery (a). The arrowhead highlights PrPC-positive punctiform structures at z = 1. Along the z-axis, a primary cilium, as probed by TubAc, progressively appears (from z = 3), while the PrPC signal progressively disappears. White arrows point to the centrosomes of a mitotic cell and highlight the absence of detectable PrPC. Co-localization of PrPC with γTub (arrowheads) at the apical face of the neuroepithelium (forebrain; b) and in cells from the omphalomesenteric artery (c). Co-localization (arrowheads) or co-regionalization (plain arrowheads) between PrPC and Rab11 at the apical face of the neuroepithelium in the forebrain (d), at the floor plate of the neural tube in the trunk region (e), and at the omphalomesenteric artery (f). The dotted lines delimit the lumen. Scale bar: 5 μm.

