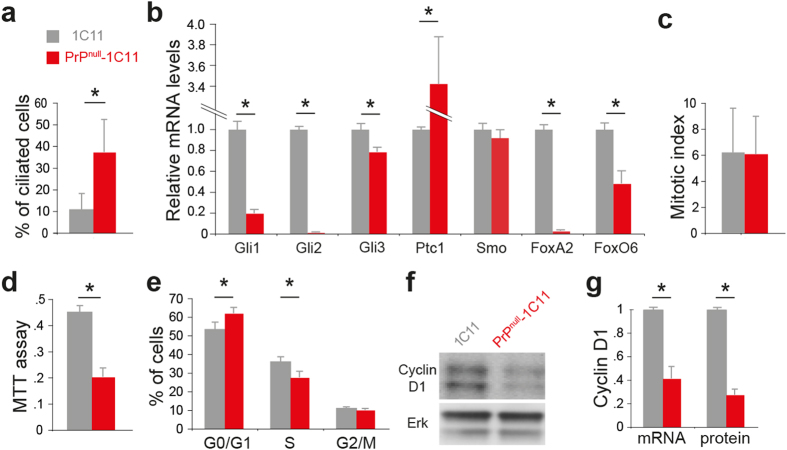
Figure 3. Primary cilium biology in PrPC-depleted 1C11 cells.
1C11 and PrPC-depleted cells (PrPnull-1C11) were compared with regard to the percentage of ciliary cells (a, n = 30 fields of view (~700 cells)). qPCR results showing the expression of Shh-related transcription factors, the Shh receptor Patched 1 (Ptc1) and Smoothened signal transducer transmembrane protein (Smo) are presented ((b), (n = 3)). The mitotic index ((c), n = 19 fields of view analysed per cell type, analysis on 3000–6000 cells), cell proliferation ((d), n = 3 MTT), proportion of cells in the different phases of the cell cycle ((e), n = 3), protein and transcriptional levels of Cyclin D1 ((f,g) and an immunoblot using Erk to normalize the protein levels ((f) n = 3) are shown. (*p < 0.05, Student test (a) or Mann-Whitney test (b–g)). The gels shown in panel (f) have been cropped for clarity and conciseness purposes, and have been run under the same experimental conditions; the original blots are shown in supplemental Figure S8a.

