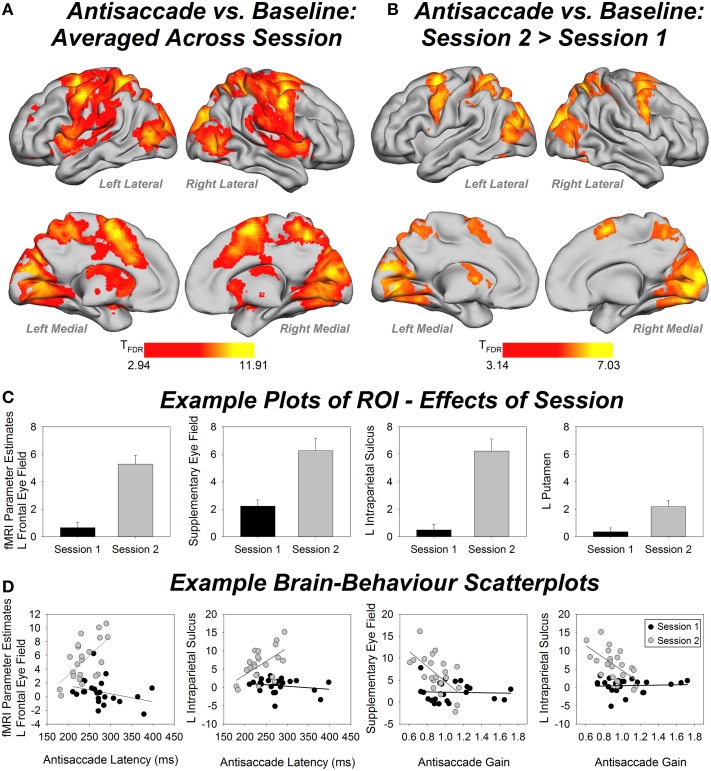
Figure 4.
(A) Whole-brain fMRI activity for the antisaccade vs. baseline condition, averaged over session. Contrast thresholded at FDR corrected p < 0.01, extent threshold p < 0.05. (B) Whole-brain fMRI activity for antisaccade session 2 > session 1. Contrast thresholded at FDR corrected p < 0.01, extent threshold p < 0.05. (C) Example bar plots for effects of session (fMRI parameter estimates) in four regions of interest (ROIs). Error bars show standard error. (D) Example scatterplots for brain-behavior correlations for session 1 (black) and session 2 (white). Y-axis shows fMRI parameter estimates. L, left.

