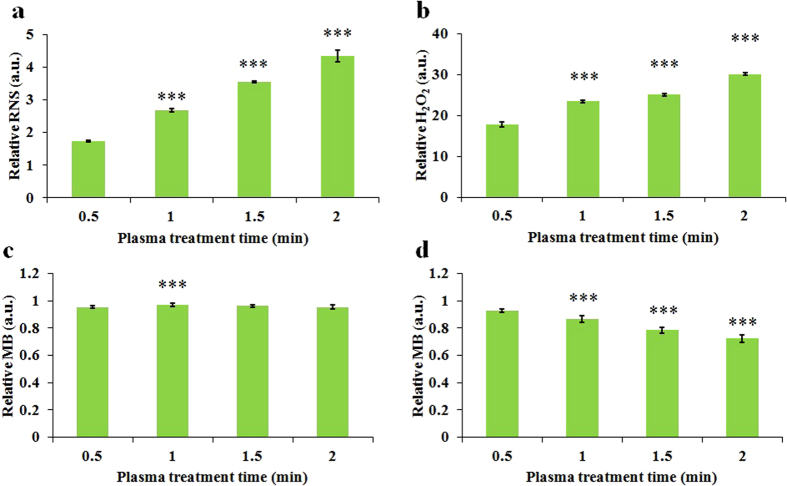
Figure 2. The dose-dependent ROS/RNS accumulation in the CAPs solution.
(a) Relative RNS concentration in 1 mL CAPs complete media. (b) Relative H2O2 concentration in 1 mL CAPs complete media. (c) Relative MB concentration in 1 mL CAPs MB solution. (d) Relative MB concentration in 2 mL CAPs MB solution. Results are presented as the mean ± s.d. of three repeated experiments performed in triplicate. Student’s t-test was performed, and the significance compared with the first bar is indicated as *p < 0.05, **p < 0.01, ***p < 0.005.

