
Figure 2.
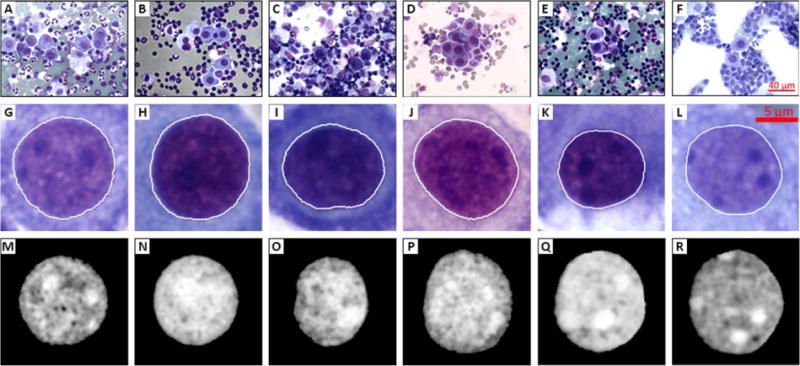
Example images showing segmentation process. First row (A–F) shows the initial digital images acquired each having a field of view, second row (G–L) shows sample segmented nuclei from digital images of the first row, and third row (M–R) shows the final images after normalization process. [Color figure can be viewed in the online issue, which is available at wileyonlinelibrary.com.]