
Figure 4.
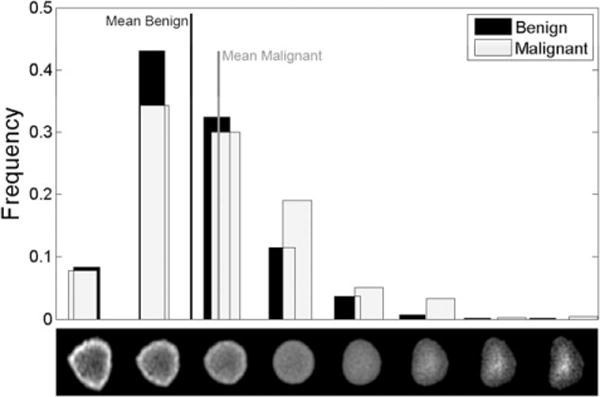
Nuclei distribution histograms for benign and malignant mesothelioma comparison. The row of nuclei images beneath the histogram bins are the normalized grayscale (upper row) visual representations of nuclei along the optimal transportation pathway (geodesic) that best discriminate between these two groups of nuclei.