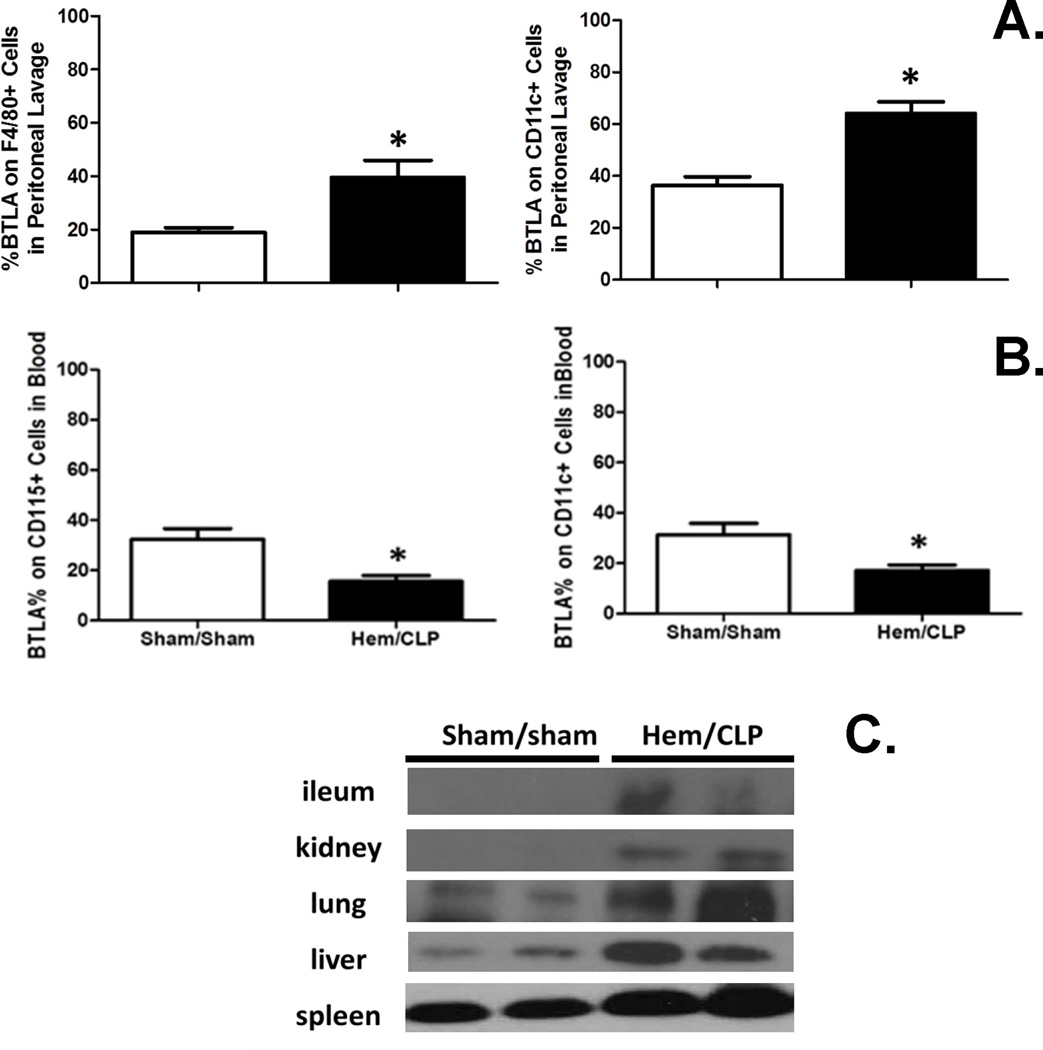
Figure 1. The changes of BTLA expression 24 hours after Hem/CLP.
(A) BTLA expression elevated on F4/80+ and CD11c+ cells in peritoneal cavity. N=5–9/group. (B) BTLA expression decreased on CD115+ and CD11c+ cells in blood. N=5–9/group. (C) BTLA expression increased in ileum, kidney, lung, liver and spleen tissues. The data are provided as the mean±SEM, and significant difference between groups is indicated as *P<0.05 by unpaired two-tailed Student’s t-test.

