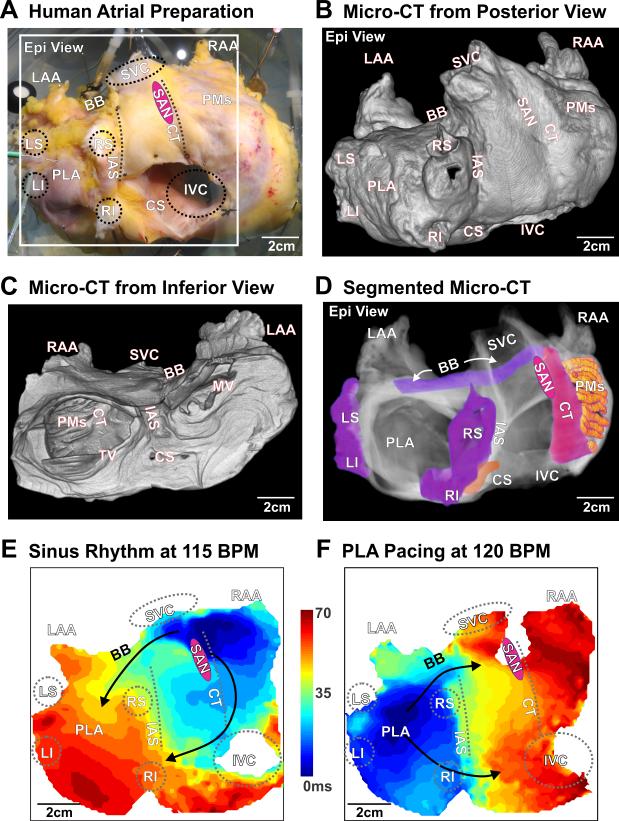
Figure 1.
High resolution optical and structural mapping of an explanted human heart during sinus rhythm (SR) and posterior left atrium (PLA) pacing. A. Coronary-perfused, explanted intact human atria; white box indicates optical mapping field of view from the epicardial surface. Novel micro-CT imaging of the optically mapped the heart at a spatial resolution of 49×49×49 μm3 visualized from an anterior (B) and posterior (C) view. Significant anatomical regions across and within both atrial chambers are highlighted (D). In the activation map of SR at 115 BPM (E) and PLA pacing at 120 BPM (F), black arrows indicate fastest conduction along major muscular bundles (B, C&D). BB – Bachmann's bundle, CS – coronary sinus, CT – crista terminalis, Epi – epicardial, LS/LI/RS/RI – left superior/left inferior/right superior/right inferior pulmonary vein, IVC/SVC – inferior/superior vena cava, LAA/RAA – left/right atrial appendage, PLA – posterior left atrium, PMs – pectinate muscles, SAN – sinoatrial node, LRA – lateral right atrium, MV – mitral valve, TV – tricuspid valve, IAS – interatrial septum.

