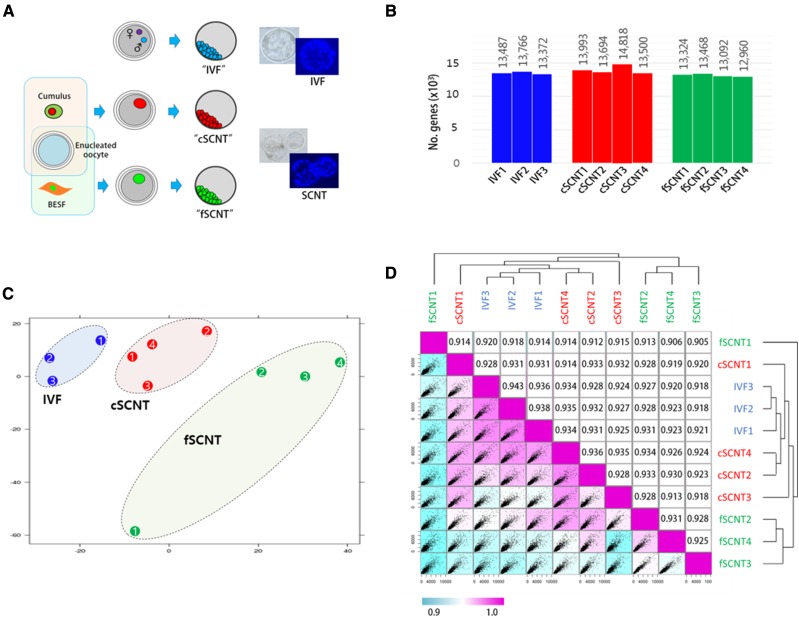
Figure 1.
Overview of cloned blastocyst production and their expression profiles. (A) Production of blastocysts derived by in vitro fertilization (IVF) or somatic cell nuclear transfer (SCNT). IVF embryos were obtained by fertilization of oocytes from unrelated cows with semen from a single bull. Cumulus cells (female) and adult ear skin fibroblasts (BESF, female) were donor cells used to obtain “cSCNT” and “fSCNT” blastocysts, respectively. IVF and SCNT embryos were cultured under identical conditions. Blastocysts were live-stained with Hoechst to count the number of blastomeres. (B) Number of detected genes expressed in each blastocyst. (C) Principal component analysis. Individual blastocysts that belong to IVF (blue), cSCNT (red), and fSCNT (green) groups are numbered. (D) Unsupervised Spearman correlation analysis. Expressional correlation coefficients (r2) between single blastocysts were calculated and plotted as a scatter matrix. Diagonally arranged pink boxes indicate the highest correlation (r2 = 1), and correlation decreases as the box color turns blue.

