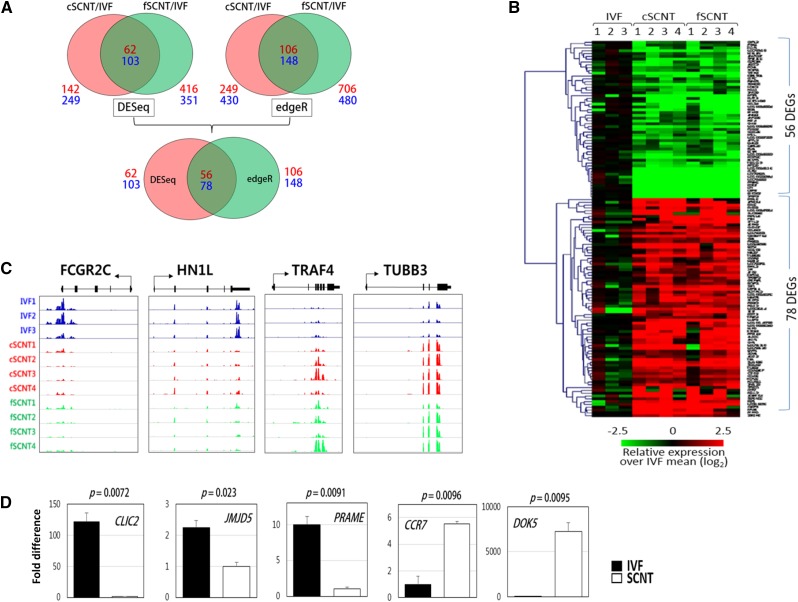
Figure 2.
Identification of differentially expressed genes (DEGs) among blastocyst groups. (A) Identification of DEGs. DESeq found 62 underrepresented (SCNT-low) and 103 overrepresented (SCNT-high) DEGs in c- and fSCNT-high DEGs, respectively, whereas edgeR detected 106 SCNT-low and 148 SCNT-high DEGs (top). Finally, the 56 SCNT-low and 78 SCNT-high DEGs that were consistent between DESeq and edgeR are identified (bottom). Numbers in red and blue designate the number of SCNT-low and -high DEGs, respectively. IVF, in vitro fertilization. SCNT, somatic cell nuclear transfer. (B) Heatmap of DEGs between IVF and SCNT blastocysts showing relative expressions over the mean of IVF single blastocysts. (C) Representative coverage plots. Read coverage of some SCNT-low (FCGR2C and HN1L) and SCNT-high (TRAF4 and TUBB3) DEGs are shown using an Integrated Genome Viewer (IGV). (D) Quantitative real-time polymerase chain reaction (PCR) validation. Differential expression of SCNT-low (CLIC2, JMJD5, and PRAME) and SCNT-high (CCR7 and DOK5) genes were validated by real-time PCR by the use of cDNAs from male IVF (solid bar) or fSCNT (blank bar) blastocysts. Error bars, standard deviation. P-values (t-test) are denoted.

