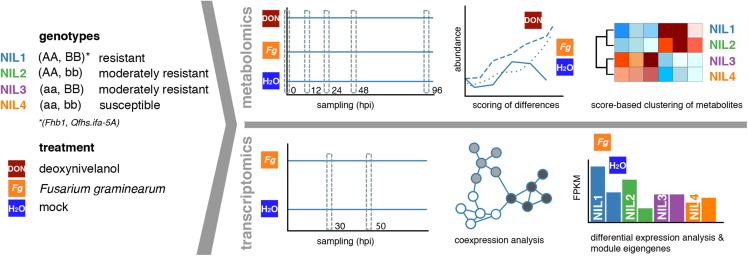
Figure 1.
Source material, experimental conditions, and analyses. Each near-isogenic line (blue: NIL1, green: NIL2, purple: NIL3, orange: NIL4) contains either the resistant or susceptible alleles of Fhb1 (AA, aa) and Qfhs.ifa-5A (BB, bb). Plants were either inoculated with F. graminearum spore suspensions, DON, or water as control. Samples were collected at different time points as indicated by gray, dashed boxes and subjected to RNA-sequencing (transcriptomics) or gas chromatography-mass spectrometry analysis (metabolomics). Transcriptomics data were characterized by the use of a coexpression network approach and differential expression analysis. Metabolomics data were characterized by the calculation of a Bayes factor score and clustering of these scores.

