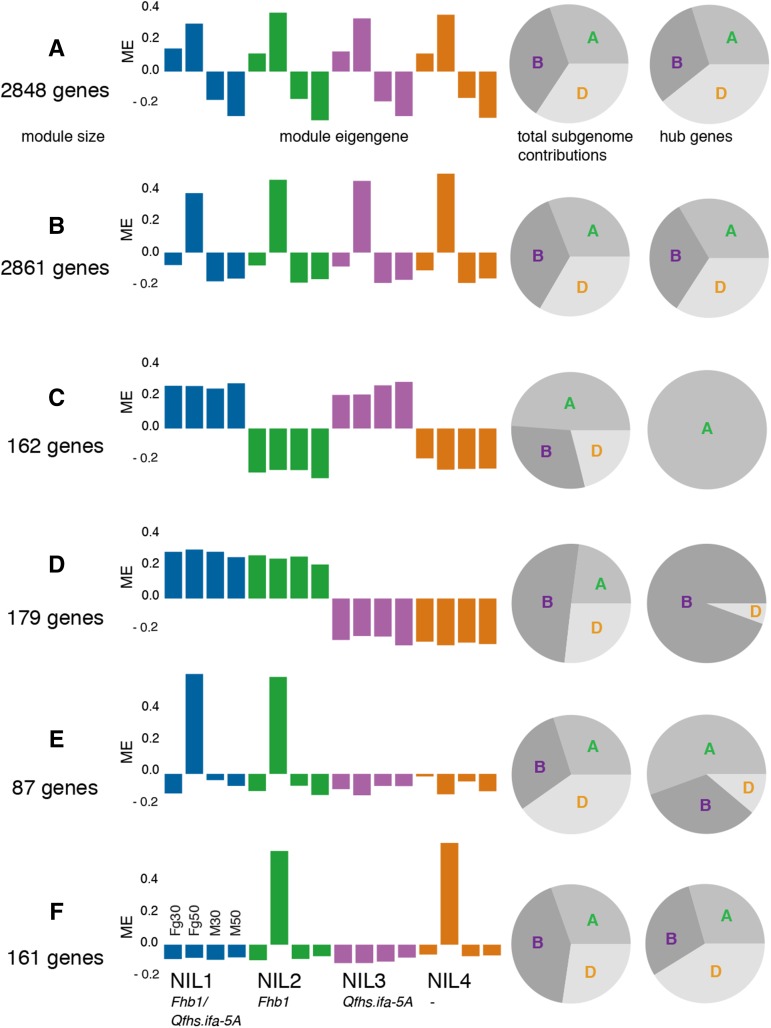
Figure 2.
Coexpression network modules. RNA-seq data were clustered into modules by inferring a weighted coexpression network. (A−F) Selected modules characterized by a general response to the fungus or are specific for QTL. The module eigengene panels (left) summarize the module-wise expression (Fg: treatment with F. graminearum, M: mock treatment, 30: 30 hpi, 50: 50 hpi; blue: NIL1, green: NIL2, purple: NIL3, orange: NIL4). Pie charts give the ratios of genes contributed by the individual subgenomes for the entire module (left) and for intramodular hub genes (right).

