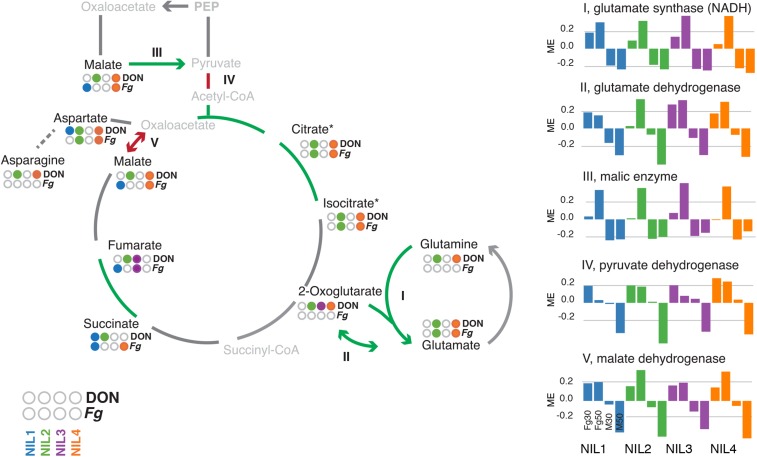
Figure 4.
QTL-associated differential transcript and metabolite abundances in the glutamate metabolism. Metabolites quantified by GC-MS are set in black, and nonmeasured and nondetected metabolites are set in gray. Treatment responsive (DON and F. graminearum (Fg); l Table S2) metabolites in the individual lines are indicated by color (blue: NIL1, green: NIL2, purple: NIL3, orange: NIL4). Green arrows/lines highlight genes with increased expression at 30 hpi for Qfhs.ifa-5A, red lines represents decreased expression at 50 hpi for Qfhs.ifa-5A. These expression differences are visualized for the isogene families by eigengene values (I-V). The individual NILs are distinguished by color. The four bars per line represent F. graminearum−inoculated samples at 30 and 50 hpi and mock-treated samples at 30 and 50 hpi from left to right.

