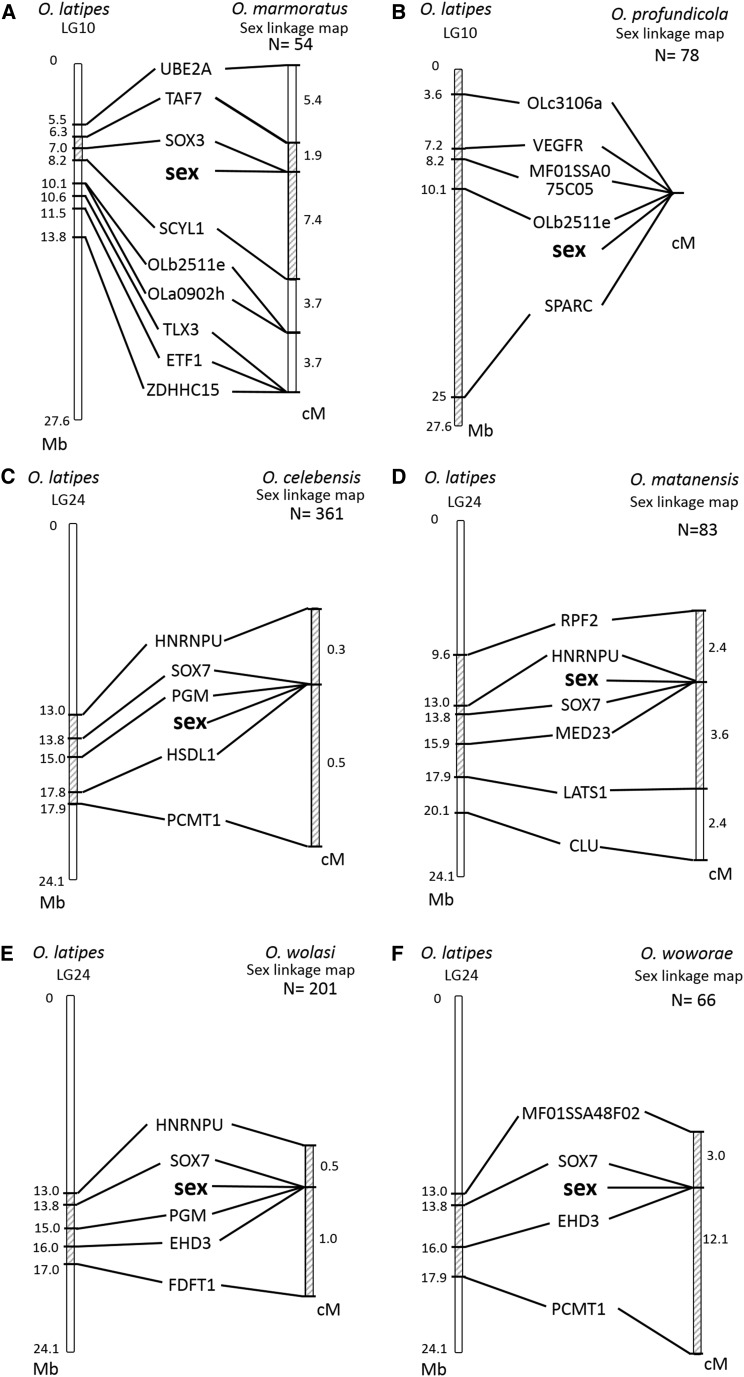
Figure 3.
Sex-linkage maps of DNA markers in O. marmoratus (A), O. profundicola (B), O. celebensis (C), O. matanensis (D), O. wolasi (E), and O. woworae (F). Comparison of the gene orders between the sex-linkage map in six species and the physical O. latipes LG 10 and LG 24 maps are also shown. Lines between the compared chromosomes connect the positions of orthologous gene pairs. The distances between flanking markers are shown as either physical length or map distance. The shaded area represents the sex-determining (SD) regions on the genetic maps and the corresponding regions on the physical maps.

