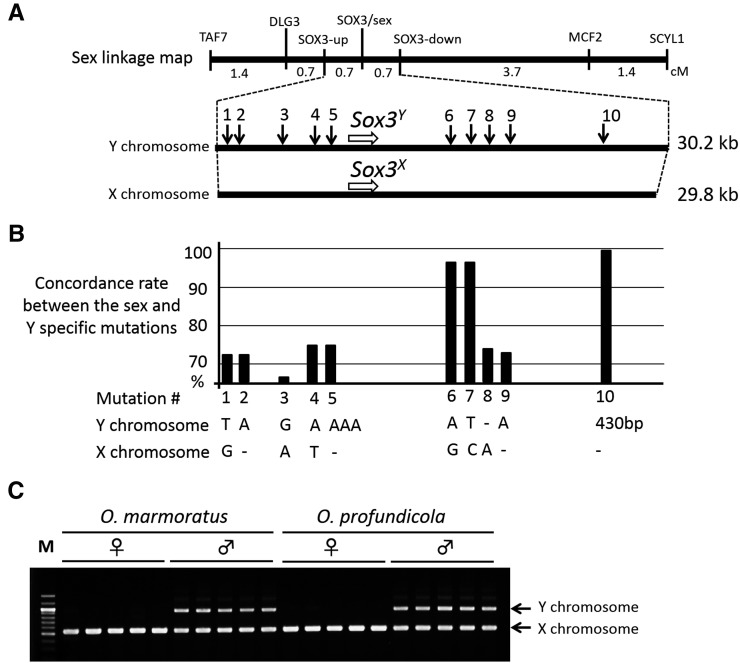
Figure 4.
Positional cloning and association analysis of the SD locus on the sex chromosomes shared between O. marmoratus and O. profundicola. (A) A high resolution genetic map around the O. marmoratus SD region using 181 progeny (top), and physical maps of the region on the Y and X chromosomes (bottom). The SD locus is mapped within a genetic interval (1.4 cM) between two markers (SOX3-up and SOX3-down), and completely links to the marker SOX3. Arrows indicate Y-specific mutations common to O. marmoratus and O. profundicola. (B) Association analysis between the phenotypic sex and Y-specific mutations in O. marmoratus and O. profundicola. Only the 430-bp insertion perfectly matches phenotypic sex in O. marmoratus (N = 68) and O. profundicola (N = 34). (C) Electrophoretic pattern of PCR product including the 430-bp insertion in O. marmoratus and O. profundicola. Upper bands indicate the Y chromosome alleles having the insertion. Lower bands indicate the X chromosome alleles without the insertion.

