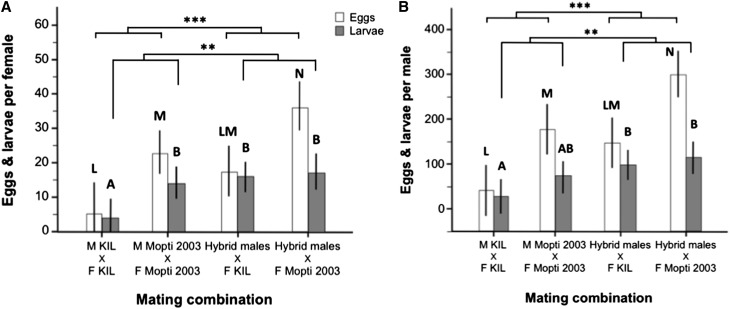
Figure 5.
Mean female and individual male reproductive success in individual-male mating experiments. (A) Mean number of eggs (white bars) and larvae (gray bars) produced per mated females for individual male mating cage that produced eggs and larvae in the four treatment groups. (B) Mean number of eggs and larvae calculated per individual male for all mating cages including nonmating ones. Barplots show the group means (±95% CI). Bars sharing a letter are nonsignificantly different, those with different letters significantly different.

