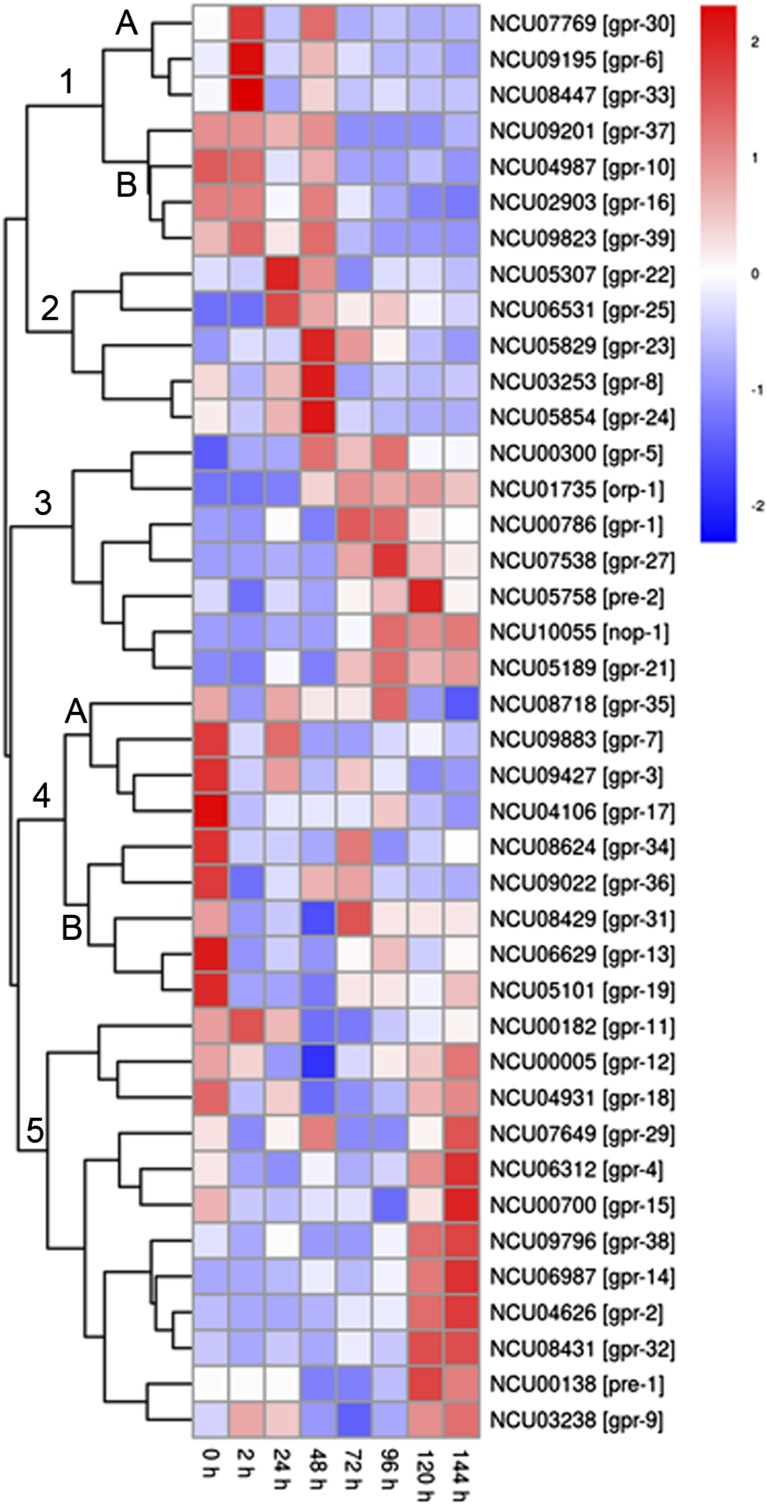
Figure 3.
Clustering and heatmap generation of mRNA expression data for N. crassa G protein−coupled receptor (GPCR) genes during a time course of sexual development. RNAseq data were mined from (Wang et al. 2014). Expression data for 37 of the 43 predicted GPCR genes was contained in the dataset and a heat map prepared as described in the section Materials and Methods. Red color denotes greater levels of expression, whereas blue corresponds to lower expression.

