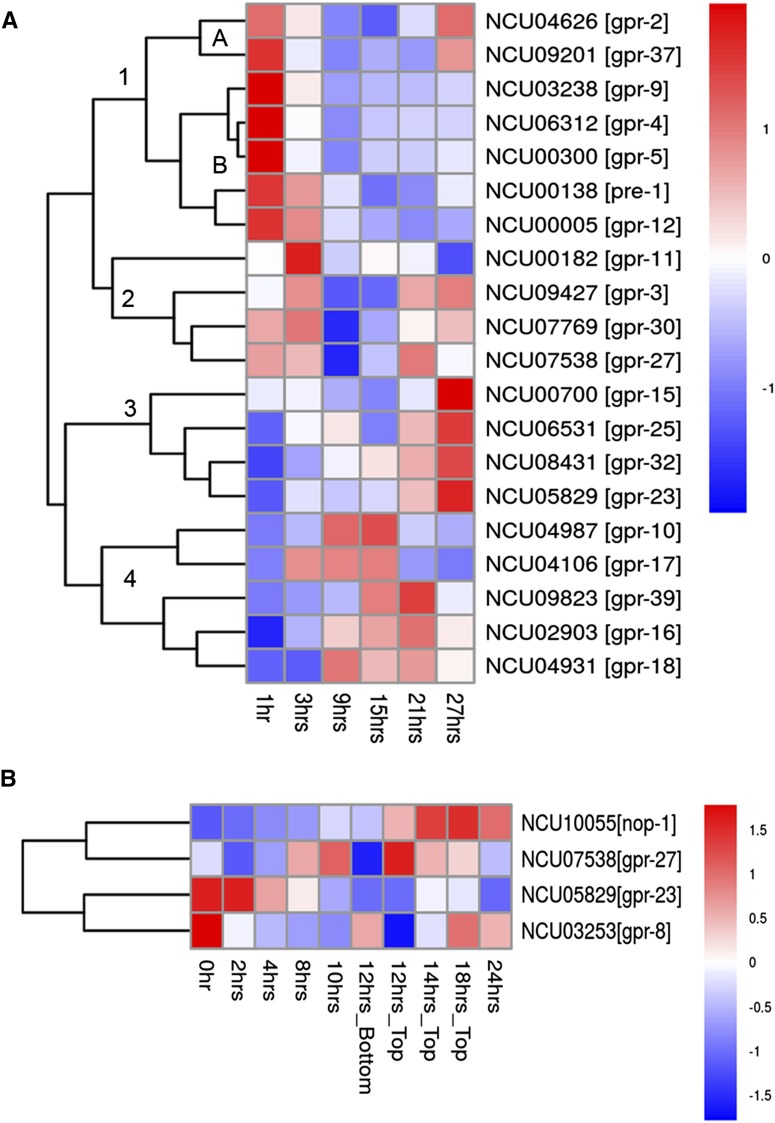
Figure 4.
Clustering and heatmap generation of mRNA expression data for N. crassa G protein−coupled receptor (GPCR) genes during time courses of colony growth and asexual development (conidiation). Data were taken from the indicated sources and heat maps generated as described in the section Materials and Methods. Red color denotes greater levels of expression, whereas blue corresponds to lower expression. (A) Gene expression during colony growth. Microarray data were obtained from (Kasuga and Glass 2008) for 20 predicted GPCR genes expressed during colony growth. (B) Gene expression during conidiation. Microarray data were mined from (Greenwald et al. 2010) for four predicted GPCR genes expressed during asexual development (conidiation).

