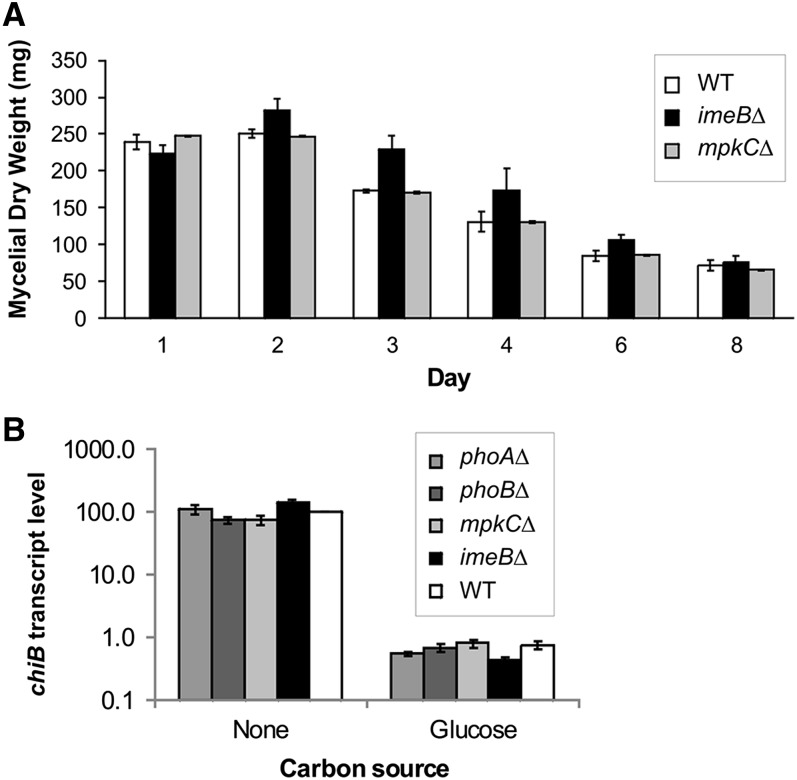
Figure 3.
Effect of protein kinase mutants on autolysis. (A) Loss of mycelial mass was monitored for 8 days in submerged cultures inoculated with 3 × 10⁸ conidia. The average for the three experiments and standard errors are shown. The mycelial dry weight of the two mutants did not differ from the mass of the WT strain at each time point when the data were analyzed using an unpaired t-test. (B) Levels of the chiB transcript relative to actA mRNA levels. The chiB encoded chitinase is a marker of autolysis. The results are the average for three independent RNA preparations, each of which was assayed in duplicate. Transcript levels and standard errors, relative to the levels in the WT control during carbon starvation, are shown. Note the log scale on the x-axis. The data were analyzed using ANOVA after loge transformation. The 95% confidence intervals for all four mutants overlapped with the 95% confidence intervals for the WT strain. The strain numbers for the mutants is given in the legend of Figure 2, and the full genotypes are listed in Table 1.

