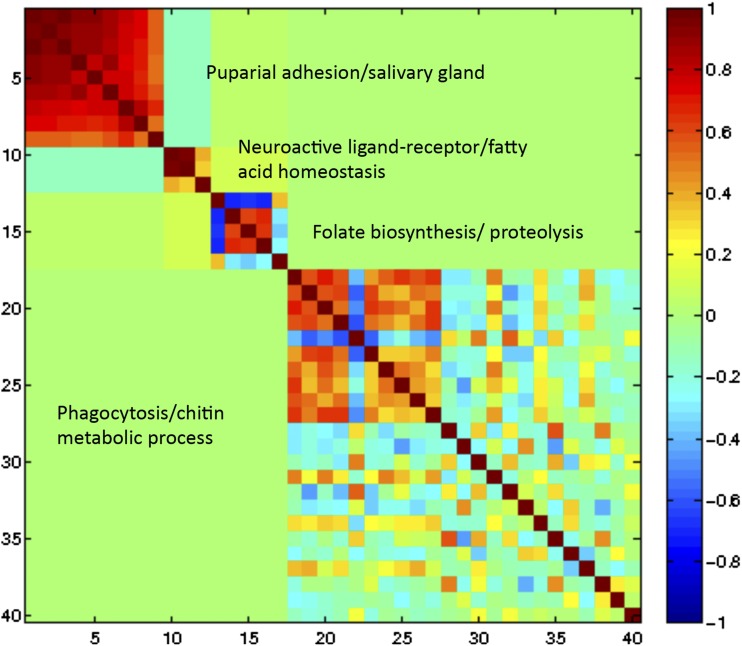
Figure 2.
Modularity clustering of 40 transcripts significant for a genotype-by-diet interaction effect produces four distinct modules. Modules one through 4 are ordered from left to right. A total of 11,650 transcripts were tested and significance was determined at false-discovery rate = 0.05 (n = 219). Transcripts are grouped by correlated expression pattern, with red indicating a positive correlation and blue a negative correlation. Gene Ontology term enrichment is provided next to each module. The most strongly intercorrelated module (module one) was enriched for puparial adhesion and salivary gland gene function.

