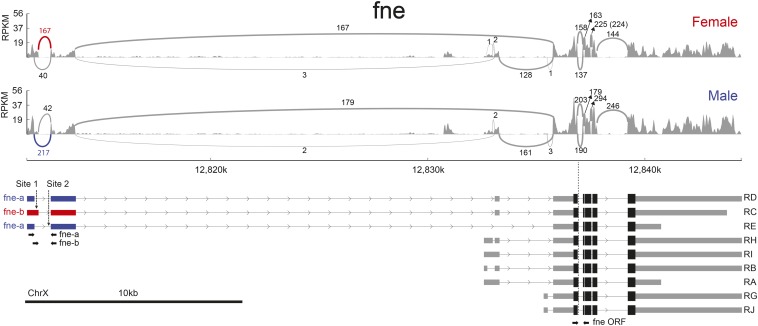
Figure 1.
Graphic representation of sex-biased alternative splicing for fne in the RNA-Seq analysis. RPKM for each alignment track are shown as sashimi plots (Katz et al. 2015). Arcs denote splice junctions, quantified in spanning reads, as specified near each exon junction. Exons and splice junctions relevant to the sex-biased splice event are in red (female-enriched junction) or blue (male-enriched junction). The nine transcripts predicted by the FlyBase (5.57) gene model are shown at the bottom. We have sequenced cDNAs that link the 5′ alternatively regulated exons to the fne ORF (see Materials and Methods). X chromosome coordinates are indicated and arrows in introns represent the direction of transcription. The structure of the RT-PCR amplicons specific for fne-a, fne-b, and fne ORF, respectively, are shown with converging arrows below the transcript diagrams. The position of the stretches UUUUUUAUCUCUUUUU (site 1) and UUUUUUUU (site 2) mentioned in File S4 are shown with vertical arrows.

