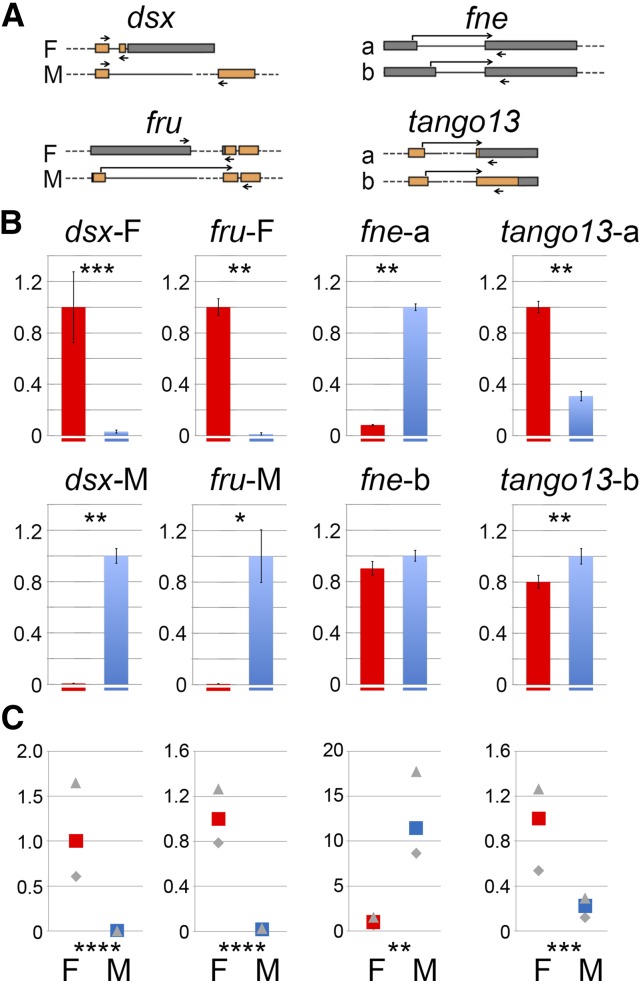
Figure 2.
Sex-dependent alternative splicing of dsx, fru, fne, and tango13. (A) Diagrams of the qPCR tested sex-biased alternative splicing events. Exons are represented by boxes; orange indicates coding regions and gray indicates untranslated regions (UTRs). Introns are represented by lines (in scale) and dashes (out of scale). The positions of the primers used for qPCR analysis are indicated by arrows joining two exons when a primer overlaps an exon junction. (B) qPCR analysis of four alternative splicing events. The bar plots show the female (red) vs. male (blue) relative transcript levels as determined by qPCR. P values (t-test) for the comparison of transcript abundance in female vs. male are indicated on each panel. *P ≤ 0.05, **P ≤ 0.01, ***P ≤ 0.001, ****P ≤ 0.0001 (see File S2). (C) As a convenient way to compare splicing between two genotypes, we use enrichment values. The average enrichments are computed from our qPCR quantifications as [abundance of transcript form a / transcript form b] in one genotype relative to [abundance of transcript form a / transcript form b] in CS females. By definition, the enrichment is 1 in CS female. Maximum and minimum enrichments calculated from our qPCR quantifications are indicated in gray. The complete statistical analysis of enrichments is in File S3 (Fay and Gerow 2013). P values for the comparisons of enrichments are indicated below the bar plots (*, **, ***, and **** as above).

