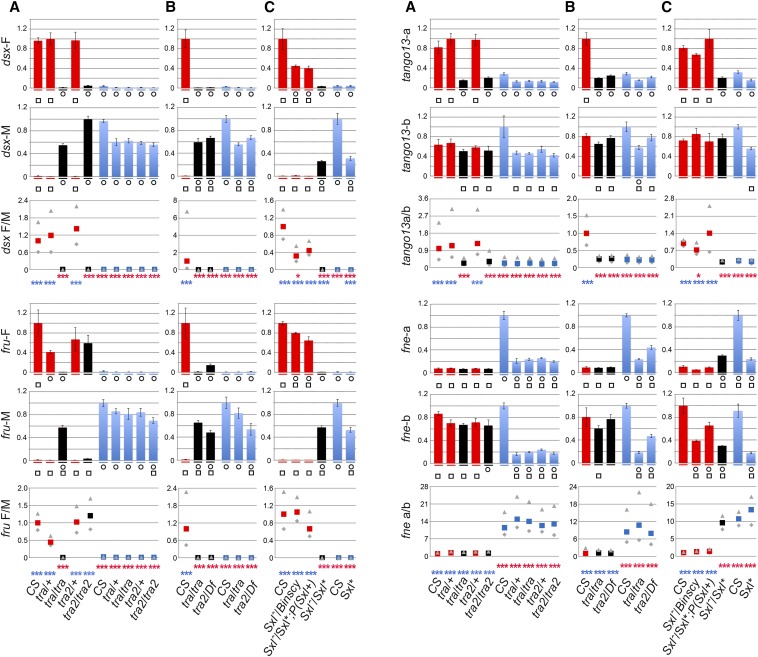
Figure 3.
Impact of tra, tra2, and Sxl mutations on alternative splicing. The bar plots show relative transcript levels as determined by qPCR in females (red), males (blue), and pseudomales represented in black. The primers used for qPCR are specified in Figure 2A and Table S2, and genotypes are indicated below the bar plots. Heterozygous and homozygous flies mutant for tra, tra2, and Sxl, respectively, are siblings. They were respectively obtained from the cross between female w1118; tra1/TM3 Sb and male w+; st tra1/T(2;3) CyO TM1, from the cross between female y w/y w; tra2B/CyO and male w+; cn tra2B bw/CyO. tra21/Df(2R)trix and from the cross between female y/Yy+; tra21/SM1 and male Df(2R)trix/CyO. Siblings of heterozygous and homozygous Sxl mutants are generated from crosses between female y w SxlM1,fΔ33 ct6 sn3/Binscy and male y cm Sxlf7M1 ct v/Y; P(Sxl+w-)9A/+ or +/+. Conclusions of the ANOVA (two-way, followed by post hoc test): [ANOVA: F(32, 86.415) = 33.076, P ≤ 1E-5] for the experiment in (A); [F(16, 22) = 26.695, P ≤ 1E-5] for the experiment in (B); and [F(40, 42.025) = 56.186, P ≤ 1E-5] for the experiment in (C) are provided under each set of bar plots. Circles (squares) denote statistically significant departure from CS female (male) expression (as detailed in File S2). Enrichments are defined and analyzed as specified in the legend of Figure 2. The conclusions of the statistical analysis (after Bonferroni correction, see File S3) are shown in red for comparisons with CS females and in blue for comparisons with CS males. *P ≤ 0.05, **P ≤ 0.01, ***P ≤ 0.001.

