
Figure 7.
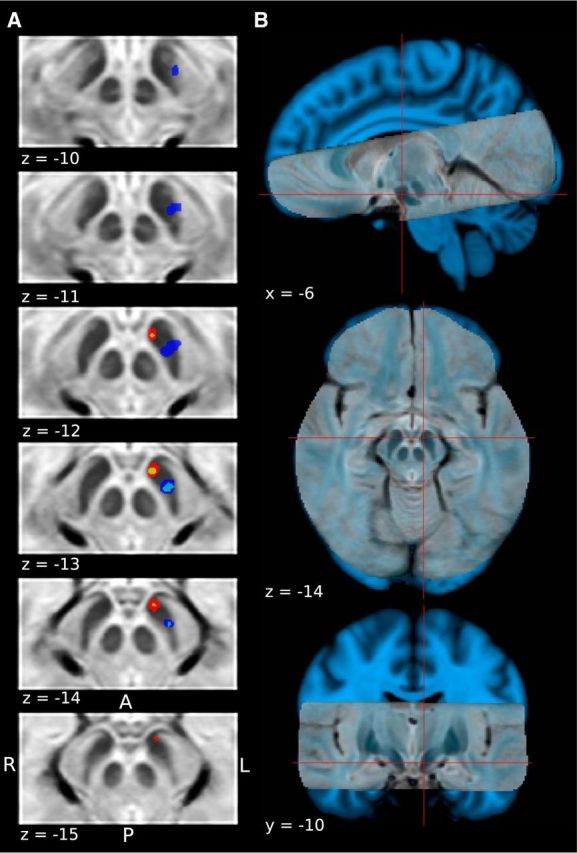
A, Comparison of extent of clusters showing a BOLD response consistent with an RPE, and a combination of expected aversive value and RPE at the onset of the distal and proximal cue, respectively. Color codes are the same as in Figures 5 and 6. B, High-resolution T2-weighted structural scan overlaid on top of the standard skull-stripped 1 mm MNI T1 brain for reference. Red cross hairs indicate location of peak voxel encoding an RPE signal in the appetitive learning session.