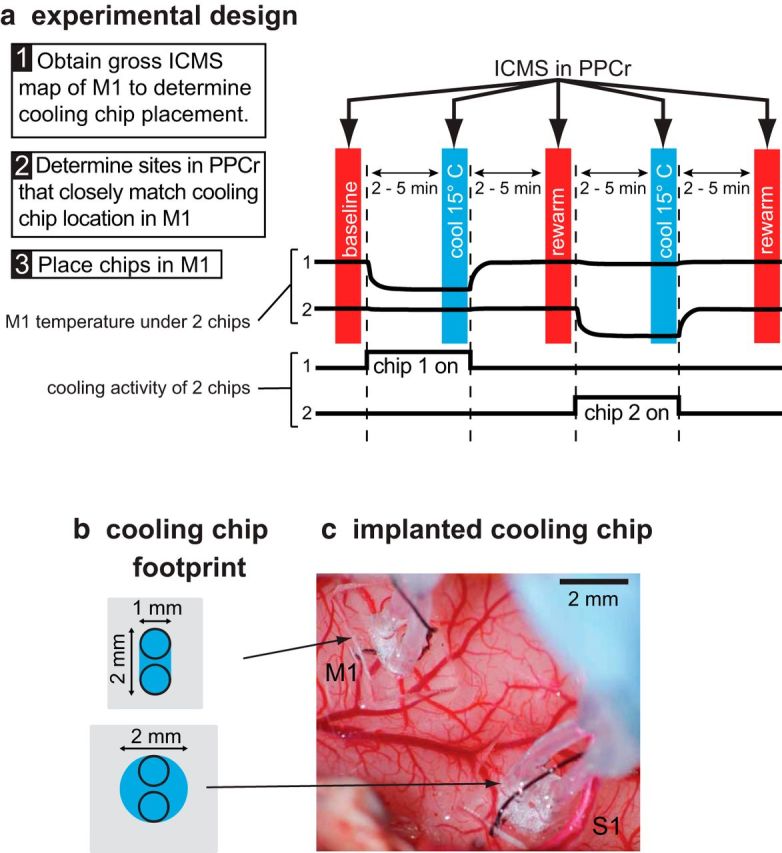
Figure 2.

Schematic of our experimental design (a), dimensions of cooling chip footprint (b), and implantation in M1 and S1 in a galago (c). a, Experiments started with gross ICMS maps of M1 (Step 1) and PPCr (Step 2). Based on these data, cooling chips were placed at one or two locations in M1 (Step 3). For each ICMS site, we tested stimulation during three epochs (vertical colored bars): baseline, cool (deactivation in M1 or S1), and rewarm (recovery). When two chips had been placed, there were two additional ICMS epochs tested: cooling of the second chip and rewarm. During each epoch, we studied movements evoked by long-train ICMS in PPCr. There was a 2–5 min interepoch interval such that ICMS data collection occurred after the cooled tissue had been stabilized for several minutes at a given temperature. Top black traces, Temperature of cortical surface under each cooling chip. Bottom black traces, Timing of cooling for each chip. Cooling devices have a small footprint (b) and are largely transparent when implanted on the cortex (c). The footprints illustrated in c are those of the cooling chips implanted in c over the forelimb lift representation in M1 and the tongue representation in S1 (case 13–37). In c, medial is to the top and rostral is to the right. Conventions are as in previous figure.
