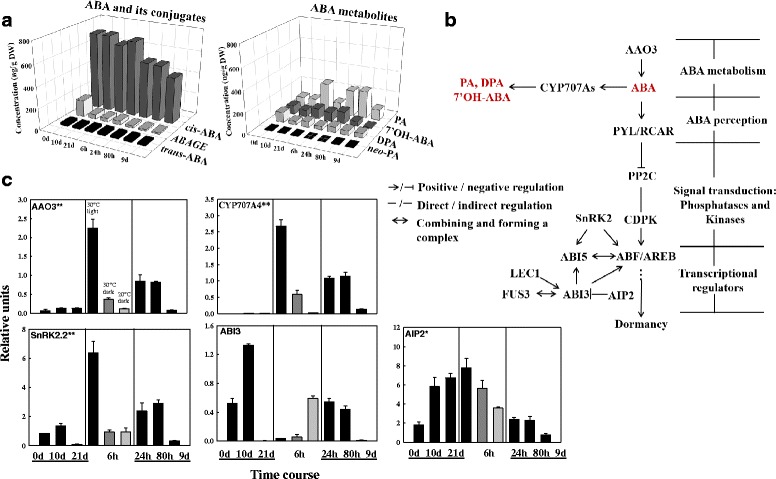
Fig. 2.

Changes in ABA, ABA metabolites, and ABA signalling components during the transition from dormancy to germination of white spruce seeds. a Profiles of ABA and its metabolites as determined by UPLC/ESI-MS/MS during moist-chilling at 3 °C (0, 10, and 21 days) and during germination (6, 24 and 80 h) and seedling growth (9 d). Each data point is the average of two biological replicates. b Schematic of ABA biosynthesis, signalling, and catabolism. c Transcript levels of ABA metabolism and signalling genes and selected downstream targets during moist-chilling (0, 10, 21 d), germination (6, 24, 80 h) and seedling growth (9 d) (black bars). Also shown are previously chilled seeds placed in two control treatments - 6 h germination conditions under darkness at 30 °C (dark grey bar) or 20 °C (light grey bar). Each data point is the average of three biological replicates. Bars indicate the SEM. Note: two superscript asterisks (**) indicate that the gene is only annotated in angiosperms; one asterisk (*) indicates that the gene has been annotated in gymnosperms but not in white spruce; no asterisk indicates that the gene has been annotated in white spruce
