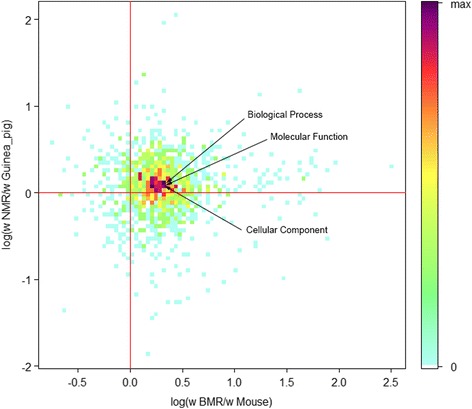
Fig. 3.

Image scatter plot; the colours indicate the density of the values of log(ω BMR/ω Mouse) and log(ω NMR/ω Guinea pig) for each of the 1307 GO terms identified. The log(ω BMR/ω Mouse) value was obtained by taking the logarithm of the (dN/dS)BMR to (dN/dS)mouse ratio. The log(ω NMR/ω Guinea pig) value was obtained by taking the logarithm of the (dN/dS)NMR to (dN/dS)GP ratio. There were 731 GO terms with log(ω BMR/ω Mouse) and log(ω NMR/ω Guinea pig) values >0; 69 GO terms with log(ω BMR/ω Mouse) and log(ω NMR/ω Guinea pig) values <0; 94 log(ω BMR/ω Mouse) <0 and log(ω NMR/ω Guinea pig) values >0, and 408 log(ω BMR/ω Mouse) values >0 and log(ω NMR/ω Guinea pig) values <0
