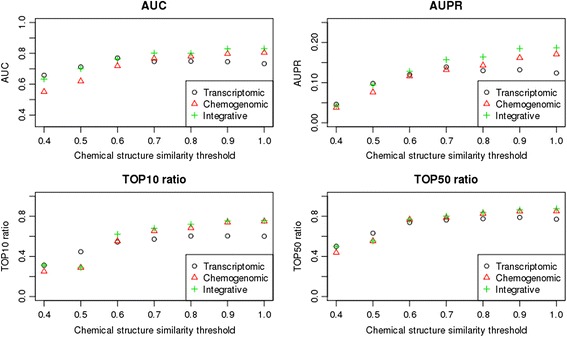
Fig. 4.

Performance of the transcriptomic approach, chemogenomic approach, and the integration of the two approaches. The performance of each approach is based on benchmark datasets containing compounds with different chemical diversities. The upper left panel shows the average AUC scores, the upper right panel shows the average AUPR scores, the bottom left panel shows the Top10 ratio, and the bottom right panel shows the Top50 ratio
