Fig. 3.

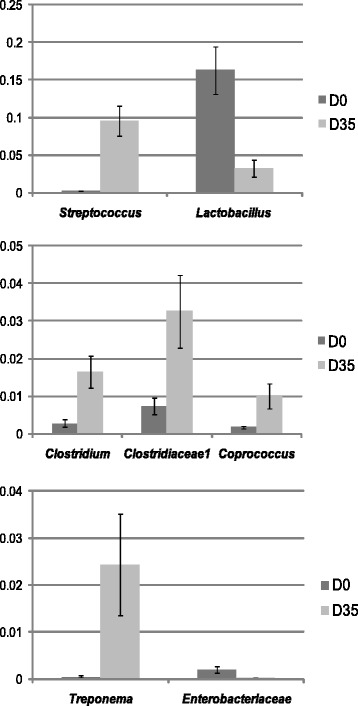
Development of the post weaning microbiome. Barcharts illustrating the taxa that differs significantly in relative abundance between samples collected at weaning (D 0) and 35 days post weaning (D 35)

Development of the post weaning microbiome. Barcharts illustrating the taxa that differs significantly in relative abundance between samples collected at weaning (D 0) and 35 days post weaning (D 35)