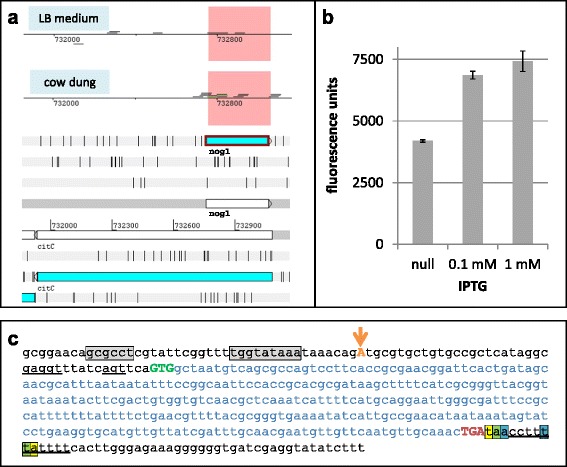
Fig. 1.

a Strand-specific transcription signals of nog1. Shown are the transcriptome data of EHEC (upper panel) grown aerobically in 1:10 diluted LB medium (upper line) or incubated in cow dung (lower line). The transcriptome sequencing reads are shown above or below the genome line for the forward and reverse strand respectively. Only a single read of citC is visible in the LB-condition. However, nog1 (pink shaded area) is induced about 14-fold in cow dung compared to LB, based on RPKM values. The lower panel shows the genomic architecture around citC, drawn using Artemis [93]. The open reading frames of nog1 and citC are indicated by blue arrows in the respective reading frames. b Fluorescence units of nog1 C-terminally fused with gfp after IPTG induction for 2 h using the indicated inducer concentrations. This experiment shows that nog1 is principally able to be translated by ribosomes. c Genetic organization of nog1. Grey, predicted promoter (BProm); orange letter, transcription start site according to the transcriptome sequencing data (Fig. 1a); orange arrow, transcription start site according to 5’-RACE; underlined, possible Shine-Dalgarno sequences; green, predicted start codon; blue, coding sequence; red, stop codon; bases highlighted by bold underline, predicted rho independent terminator with possible hairpin structure (WebGeSTer)
